
 ✖
✖
International comparisons of CO2 emissions
In comparing countries, it is important to compare like with like, and compare the per capita CO2 emissions rather than just the total CO2 emissions.
When this is done, the large countries with the worst CO2 emissions are Saudi Arabia, the USA, Canada and South Korea.
China and India, which are sometimes criticised for having large total emissions, actually have lower per-capita figures than most other large countries, and so it is wrong to pick them out for blame.
Methods for a fair comparison
To make a meaningful comparison between countries, two points are crucial.- The comparison must be of emissions per person. Little information is obtained from comparing the total emissions for whole countries since the largest countries have the biggest totals.
- All relevant emissions must be included, including emissions produced in the manufacture of goods that have been imported - see document 31: Why count consumption rather than territorial GHG emissions.
Two summary charts are given below. Once allowance is made for population size and imports/exports, it is clear that it is wrong to pick out China and India for censure.
Summary charts
The first chart compares per capita CO2 emissions for the 12 countries with the largest total emissions. The four worst countries are Saudi Arabia, the USA, Canada and South Korea.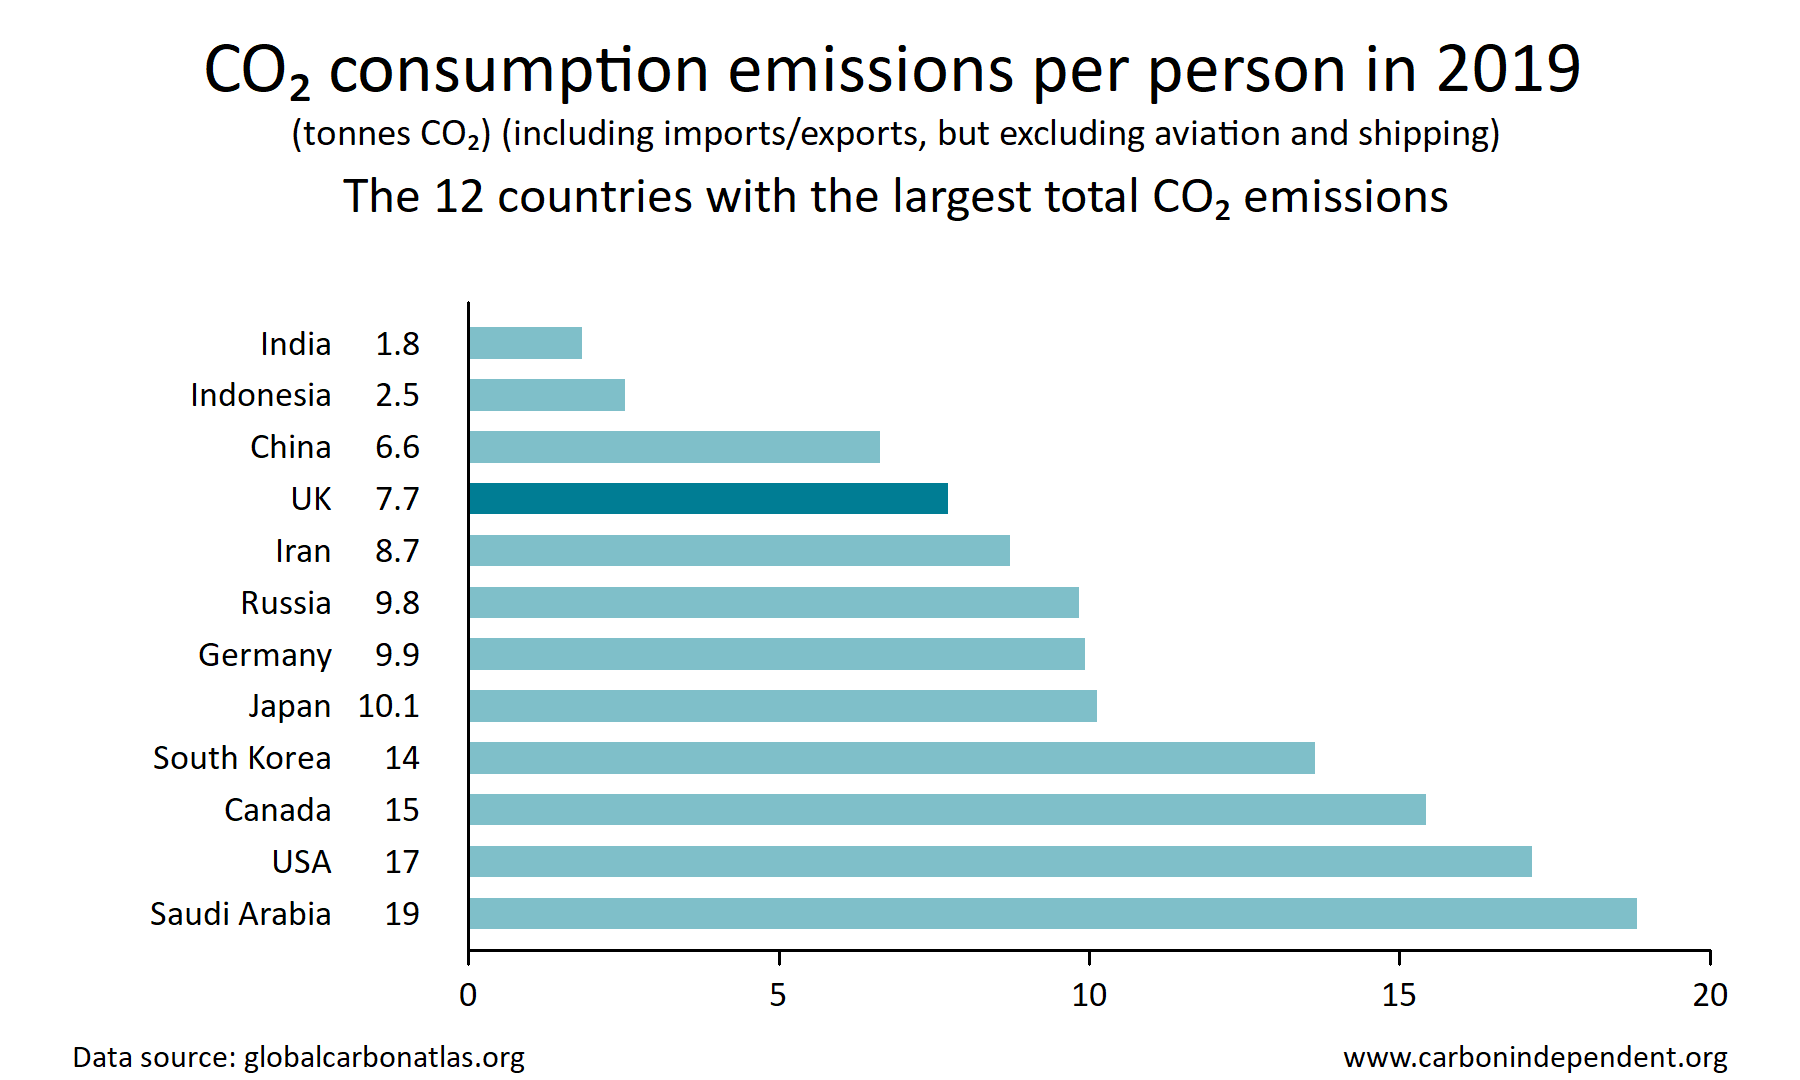
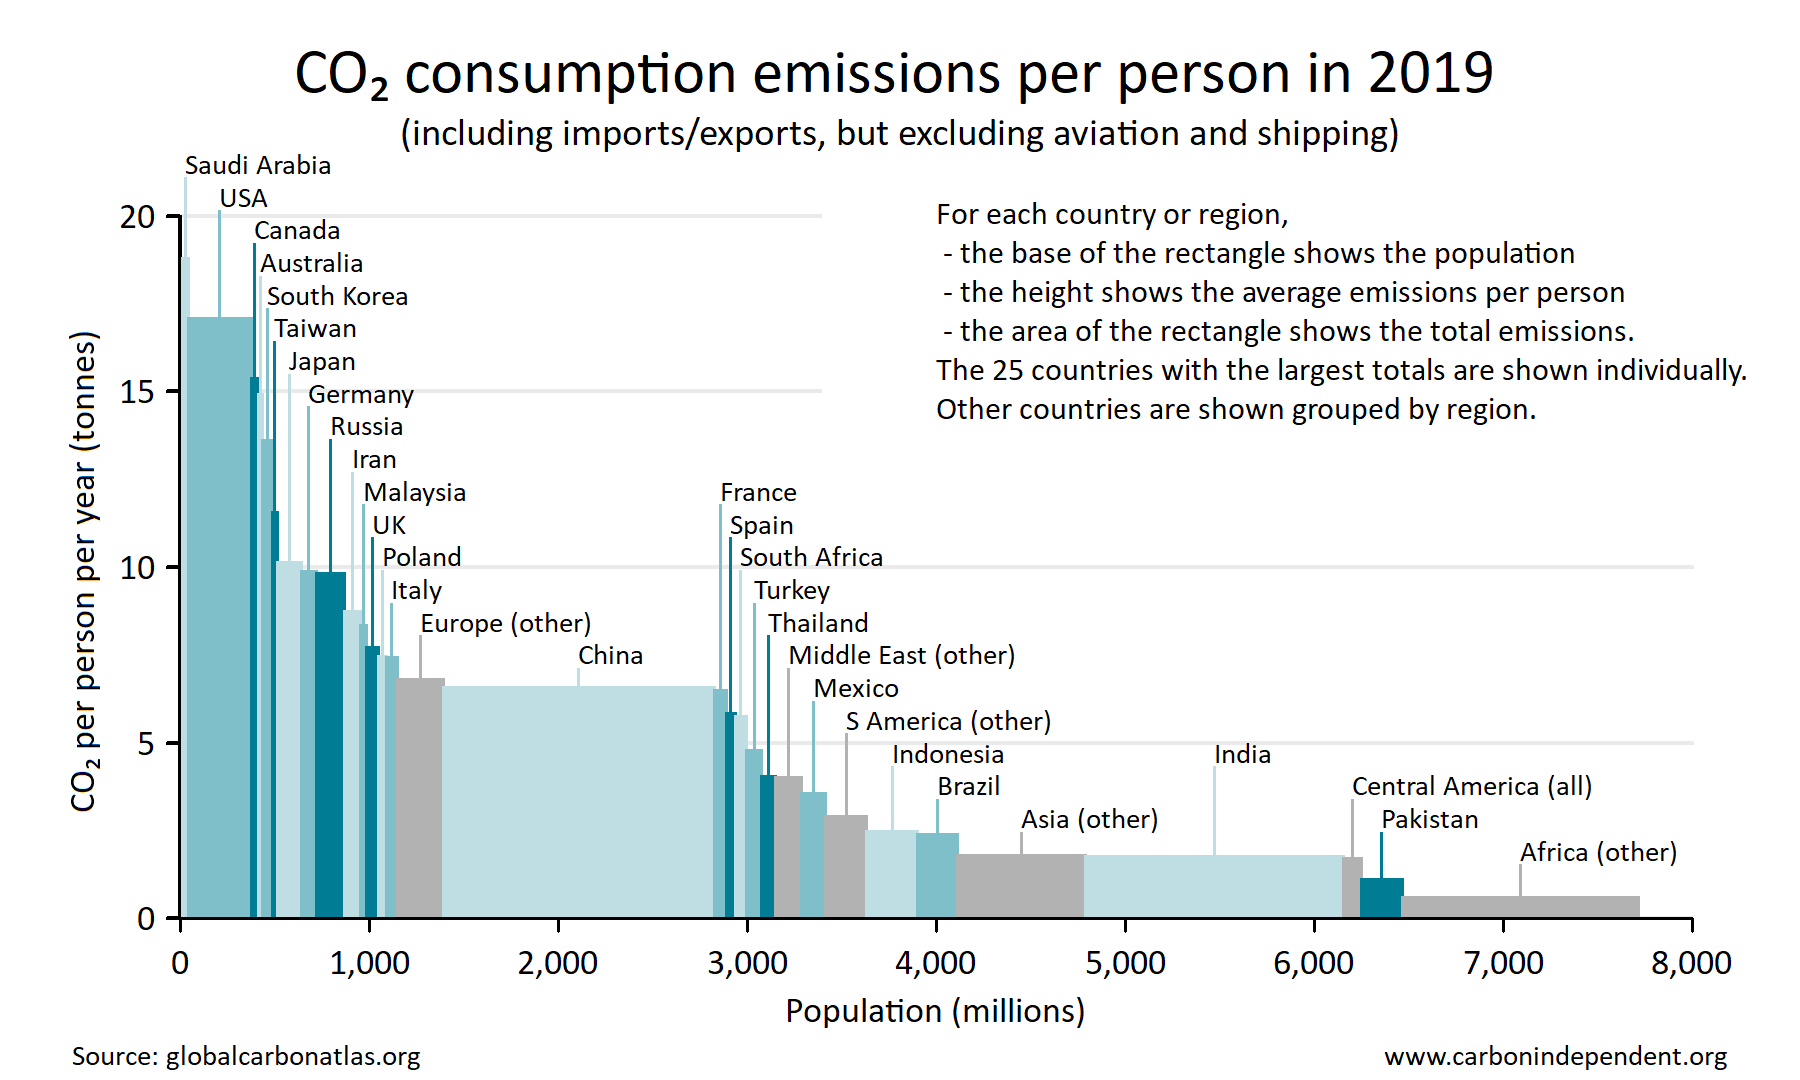
The second chart is a more elaborate chart of the same dataset, with a larger number of countries, and the remaining countries amalgamated. As well as the height of a country's rectangle showing the per capita emissions, the width of the rectangle shows the country's population, so the area of the rectangle shows the total emissions for the country.
World CO2 emissions
The total was about 36 billion tonnnes CO2 in 2019 [1].References
| [1] | https://www.statista.com/statistics/276629/global-co2-emissions/ accessed 27.9.21 |
| [2] | Global Carbon Atlas http://www.globalcarbonatlas.org/en/CO2-emissions |
Started: 26 Dec 2019