
 ✖
✖
UK carbon budget calculations 2024
This page has been superseded by UK carbon budget calculations 2026 (carbonindependent.org/195.html).
There is much agreement that CO2 emissions must be reduced in order to limit climate change, but less agreement on how fast this must be done, with the UK Government having a Net Zero 2050 policy[1], and others advocating a 2040[2] or 2030 limit[3].
Proper planning requires policies to be based on the science. This article summarises the science of carbon budgets and the choices that the UK has concerning the speed of its emission cuts.
 The conclusions from the calculations are
 - the UK's fair carbon budget for limiting global warming to 1.5°C runs out in 2 years
- the UK's current Net Zero 2050 timescale of emission cuts is grossly inadequate
- it is derived by ignoring the Paris commitment to equity between nations, ignoring emissions generated in the manufacturing of imports, and ignoring aviation.
- If the UK wants to keep its promises under the Paris Agreement, urgent radical reduction in fossil fuel use is necessary (over 90% by 2030)
- while this is the scientific consensus, it is not being widely discussed
- given the very rapid timescale, technologies such as carbon capture are not viable solutions.
- Decision making has failed
- in order to make good decisions on climate change, there must be an honest debate based on the science, and an understanding of the immense harm being done to people and planet by current lifestyles.
The science of carbon budgets
Most of the CO2 released from burning fossil fuels remains in the atmosphere for centuries or millennia, so the concentration of CO2 steadily rises. As the atmospheric CO2 rises, the average global temperature rises.From the amount of CO2 emitted in the past, and the effect that it has had, we can estimate how much more CO2 can be emitted if global warming is to be kept below a particular limit such as 1.5°C. This is known as the CO2 budget, or carbon budget.
In the Paris Agreement of 2015[4], countries promised to restrict global warming to well under 2°C, and pursue efforts to restrict it to 1.5°C. This translates to limiting further global CO2 emissions to the appropriate carbon budget. Regarding division of the global carbon budget between countries, the Paris Agreement specifies that developing countries can increase emissions for a period to facilitate economic development, while developed countries must reduce emissions immediately (i.e. faster than the global total), and specifies equity between nations, which is usually taken to mean equal per capita shares of the global carbon budget.
The scientific consensus is that global warming can be limited to 1.5°C if total global emissions since the start of 2020 are limited to 400 billion tonnes CO2[5] (this is with 67% confidence). This equates to 50 tonnes per person on the planet. This is a lifetime limit, which will run out in a country with average emissions in 2030.
The UK's fair carbon budget for limiting global warming to 1.5°C
The UK's CO2 emissions are around 8 tonnes per person per year[6][7], so the UK has already used around 32 tonnes of its per capita budget of 50 tonnes in the 4 years to the end of 2023. This leaves a residual budget from the start of 2024 of 18 tonnes CO2 per person. If emissions continue unchanged, this will run out in 2 years from the start of 2024, i.e. in 2026, much sooner than generally discussed.This article shows a number of pathways of UK emission reduction in order to illustrate the choices in the UK. The carbon budget charts have been generated by the calculator at carbonindependent.org/carbonbudgets.php, and can be replicated there. Similar calculations and conclusions have been published in academic reports[8][9][10].
1: Constant emissions: not compliant with the carbon budget
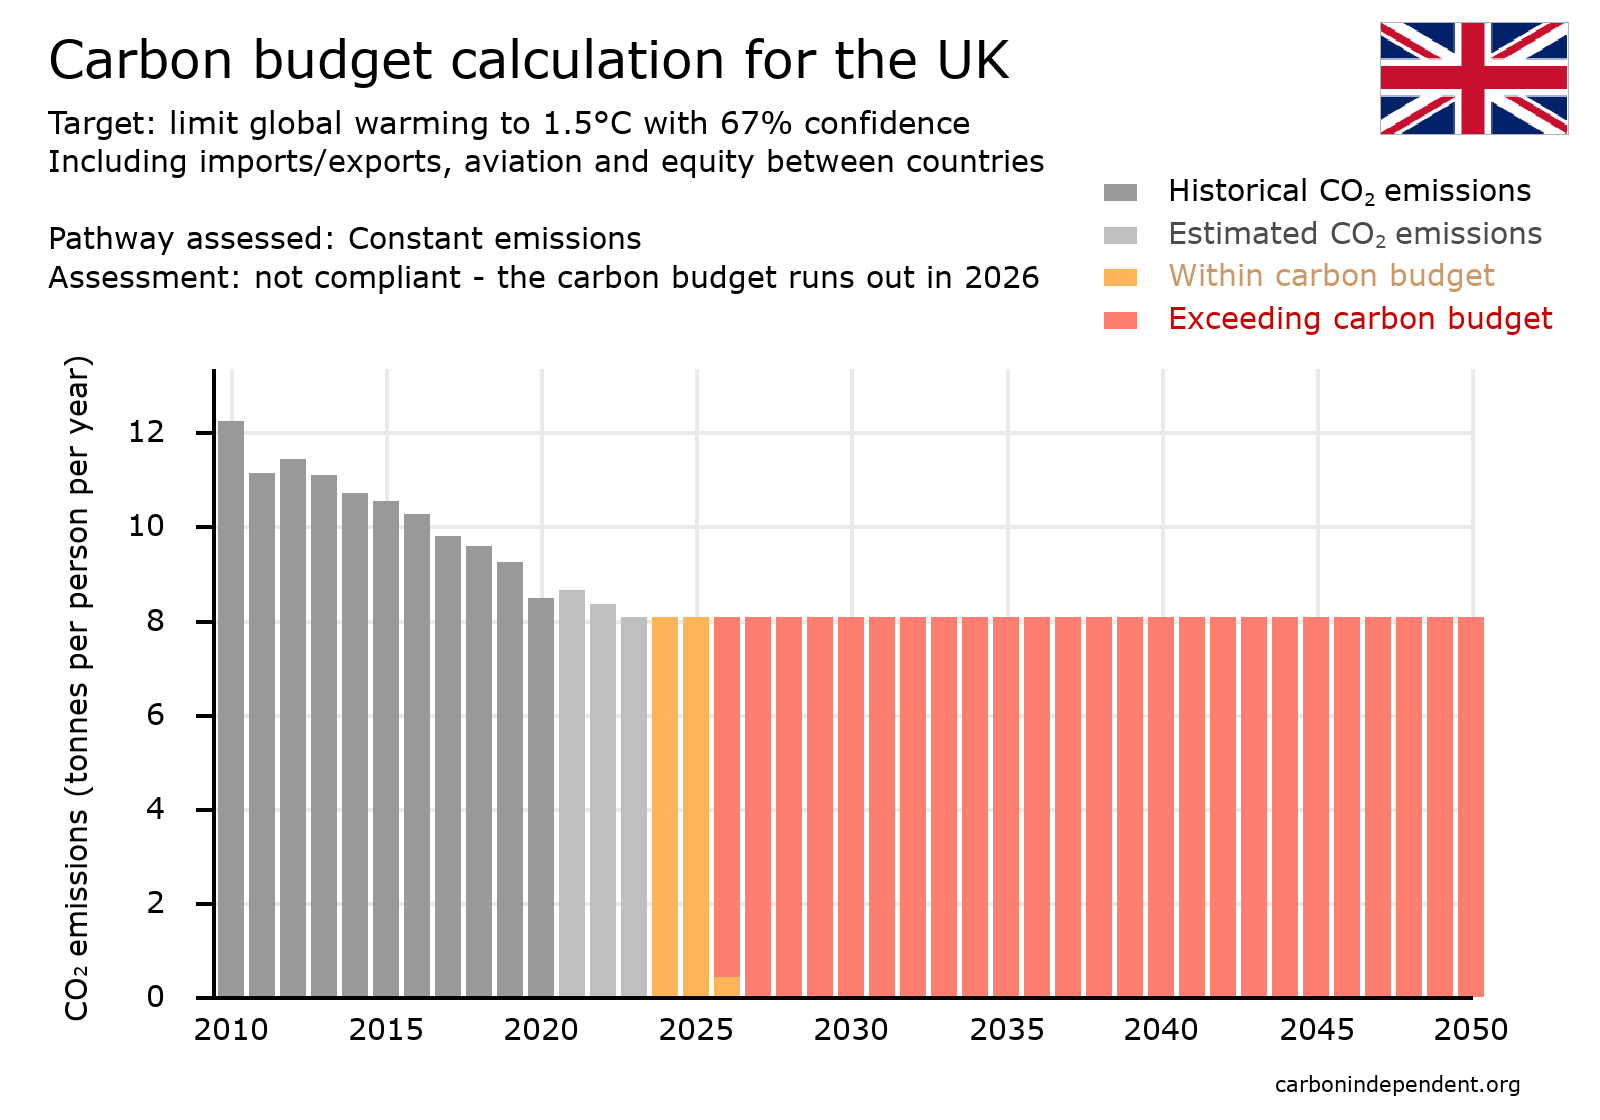 The chart shows UK CO2 emissions including imports/exports[6] and aviation[7]. Figures for years up to 2020 are the published figures. Figures for 2021 to 2023 are estimated by extrapolating the trend from 2014 to 2019.
If emissions continue unchanged, the UK's residual per person carbon budget of about 18 tonnes CO2 will run out in 2 years from the start of 2024, i.e. in 2026.
Clearly, CO2 emissions need to be reduced.
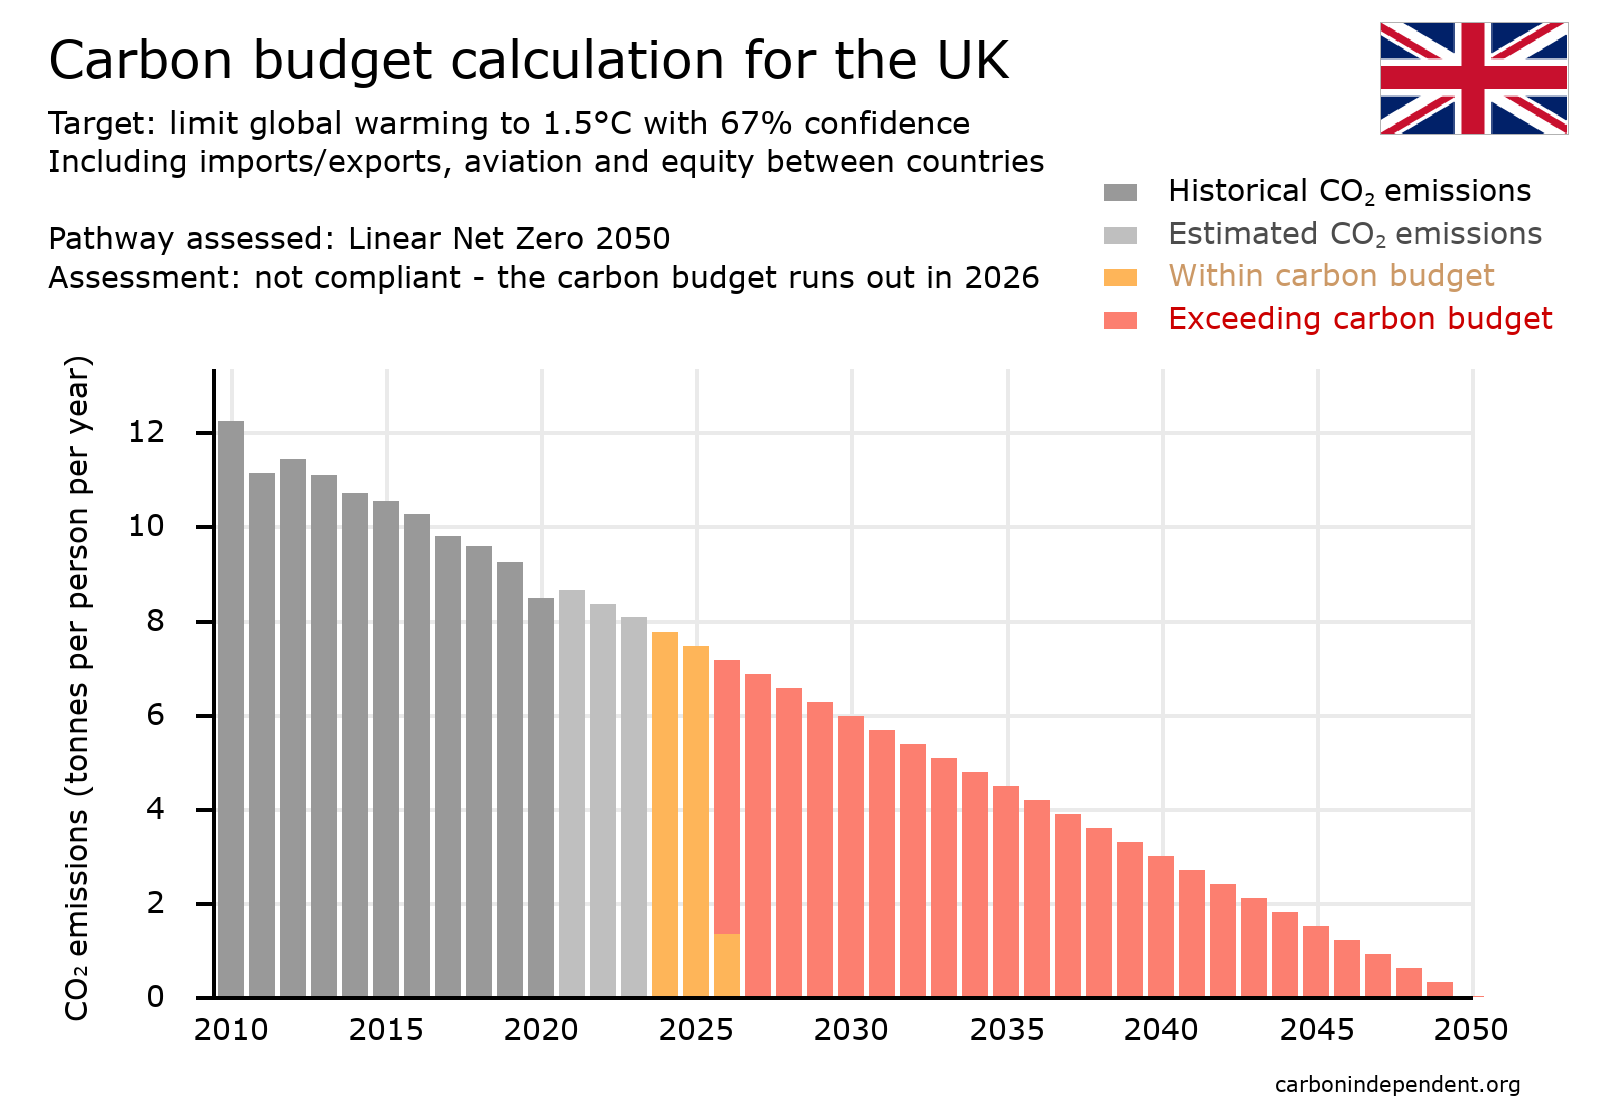
2: Net Zero 2050 (linear decline): not compliant with the carbon budget
A pathway that is much discussed is "Net Zero 2050", where net CO2 emissions are reduced to zero in 2050. It is common for no details to be given of the pathway to net zero, and yet this is crucial since it is the cumulative emissions that matter, not the net zero date.One version of net zero 2050 is to cut emissions steadily, by the same amount each year, which gives a sloping straight line on a chart of annual emissions. This can be termed "linear decline". This makes almost no difference to when the carbon budget runs out - it still runs out in 2026, and so the pathway is not compliant with the UK's residual carbon budget. It would in fact emit three times as much CO2 as the carbon budget of 50 tonnes per person.
3: Net Zero 2050 (linear decline): effect of ignoring imports
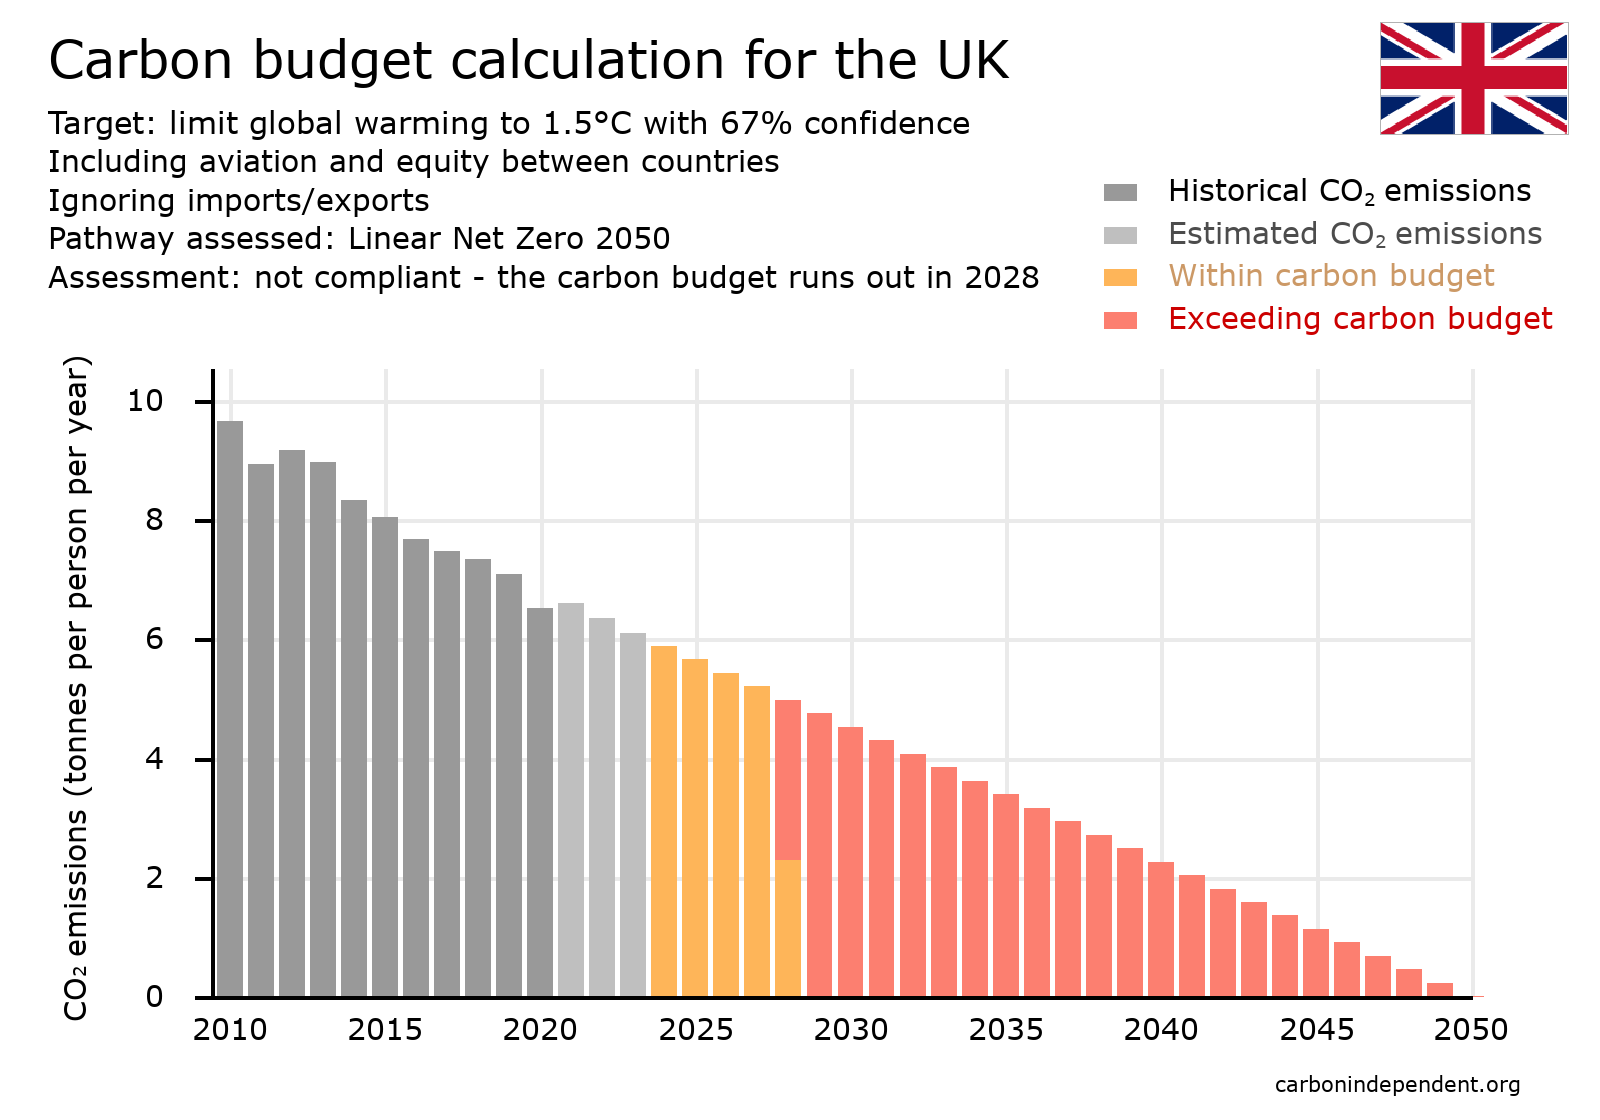 The calculations shown so far have included the CO2 emissions generated in the production of all goods consumed in the UK, whether or not the goods were manufactured in the UK. These are known as "consumption emissions"[6]. An alternative is just to count emissions released in the UK whether or not the goods are consumed in the UK. These are known as "territorial emissions". This choice of accounting method is crucial. UK consumption emissions are about 50% higher than UK territorial emissions and have fallen much less over the last few decades.
 If imports are ignored and only territorial emissions are counted, the UK carbon budget will last until 2028. The policy does have some nonsensical consequences, e.g. firstly that an item manufactured in the UK will be treated as having a carbon footprint, whereas an identical item manufactured abroad will be treated as zero-carbon; and secondly that a country's carbon footprint can be "reduced" by the transfer of manufacturing abroad, with loss of jobs and damage to the economy.
4: Net Zero 2050 (linear decline): effect of also ignoring aviation
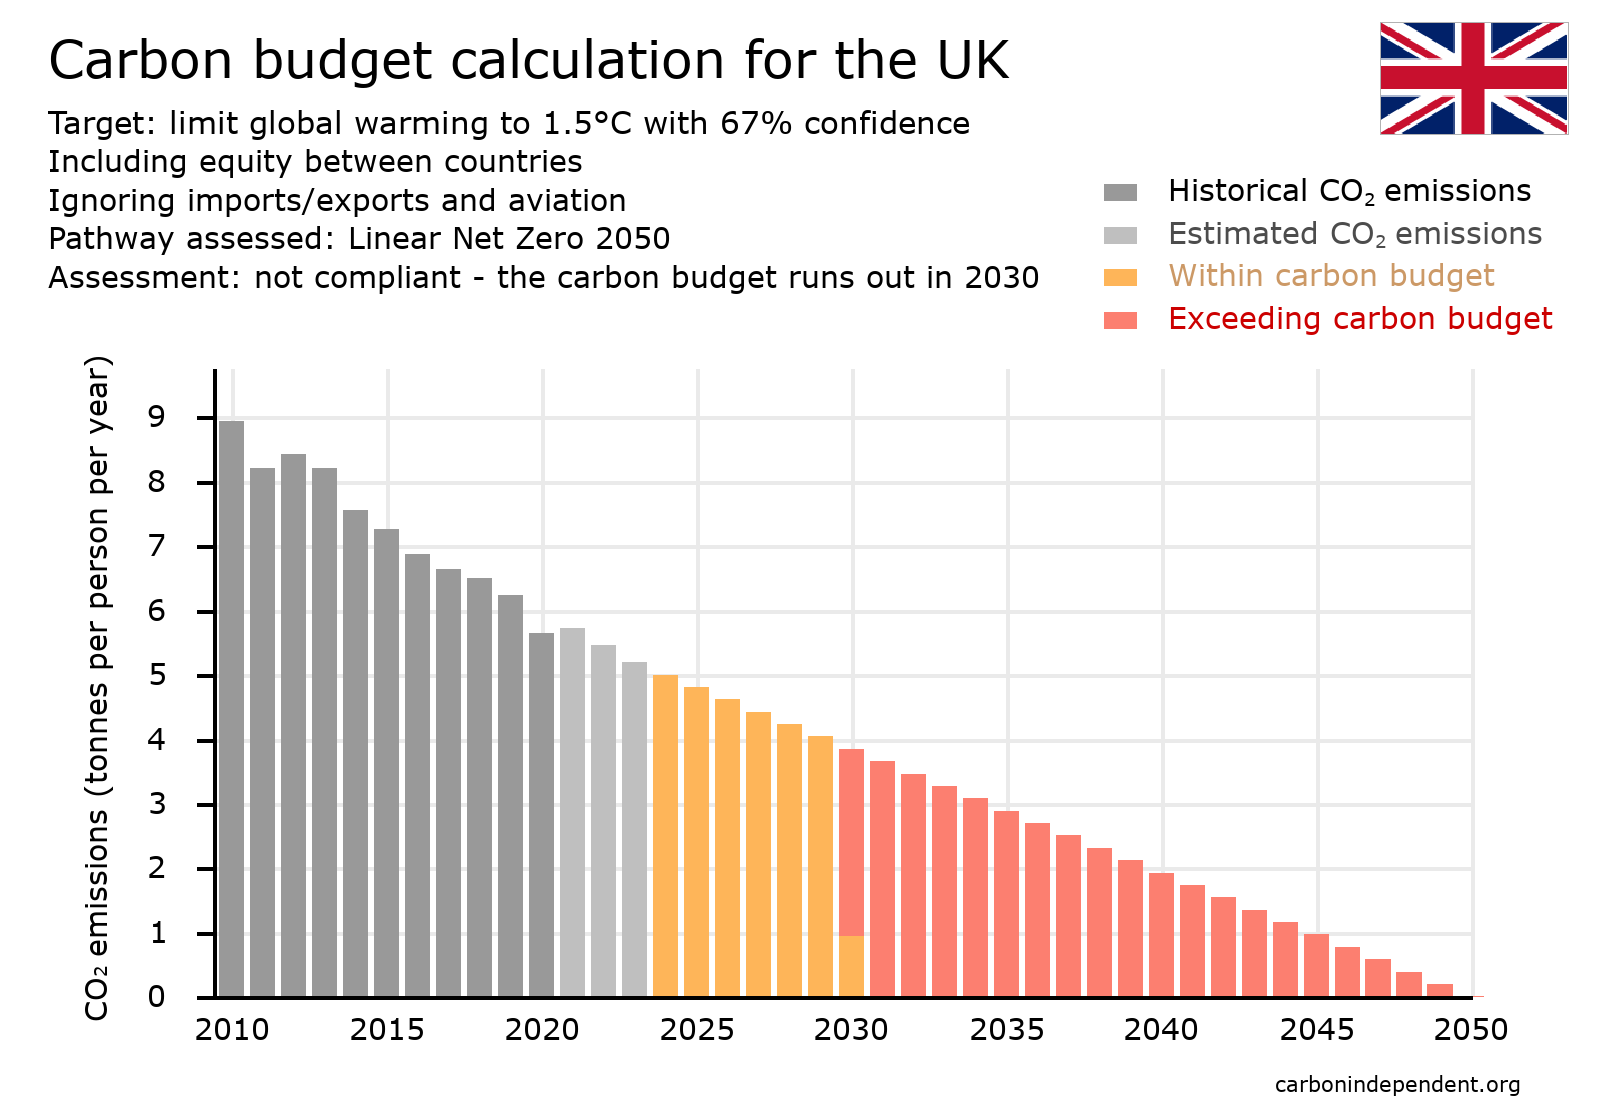 If, in addition to ignoring emissions generated in the production of imports, emissions from aviation are also ignored, then the UK's "total emissions" are reduced further, and the carbon budget will last longer, i.e. until 2030, as shown in the chart. The problem of course is that the emissions from flights by UK residents still build up in the atmosphere and increase global warming.
 5: Net Zero 2050 (linear decline): effect of also ignoring equity between nations
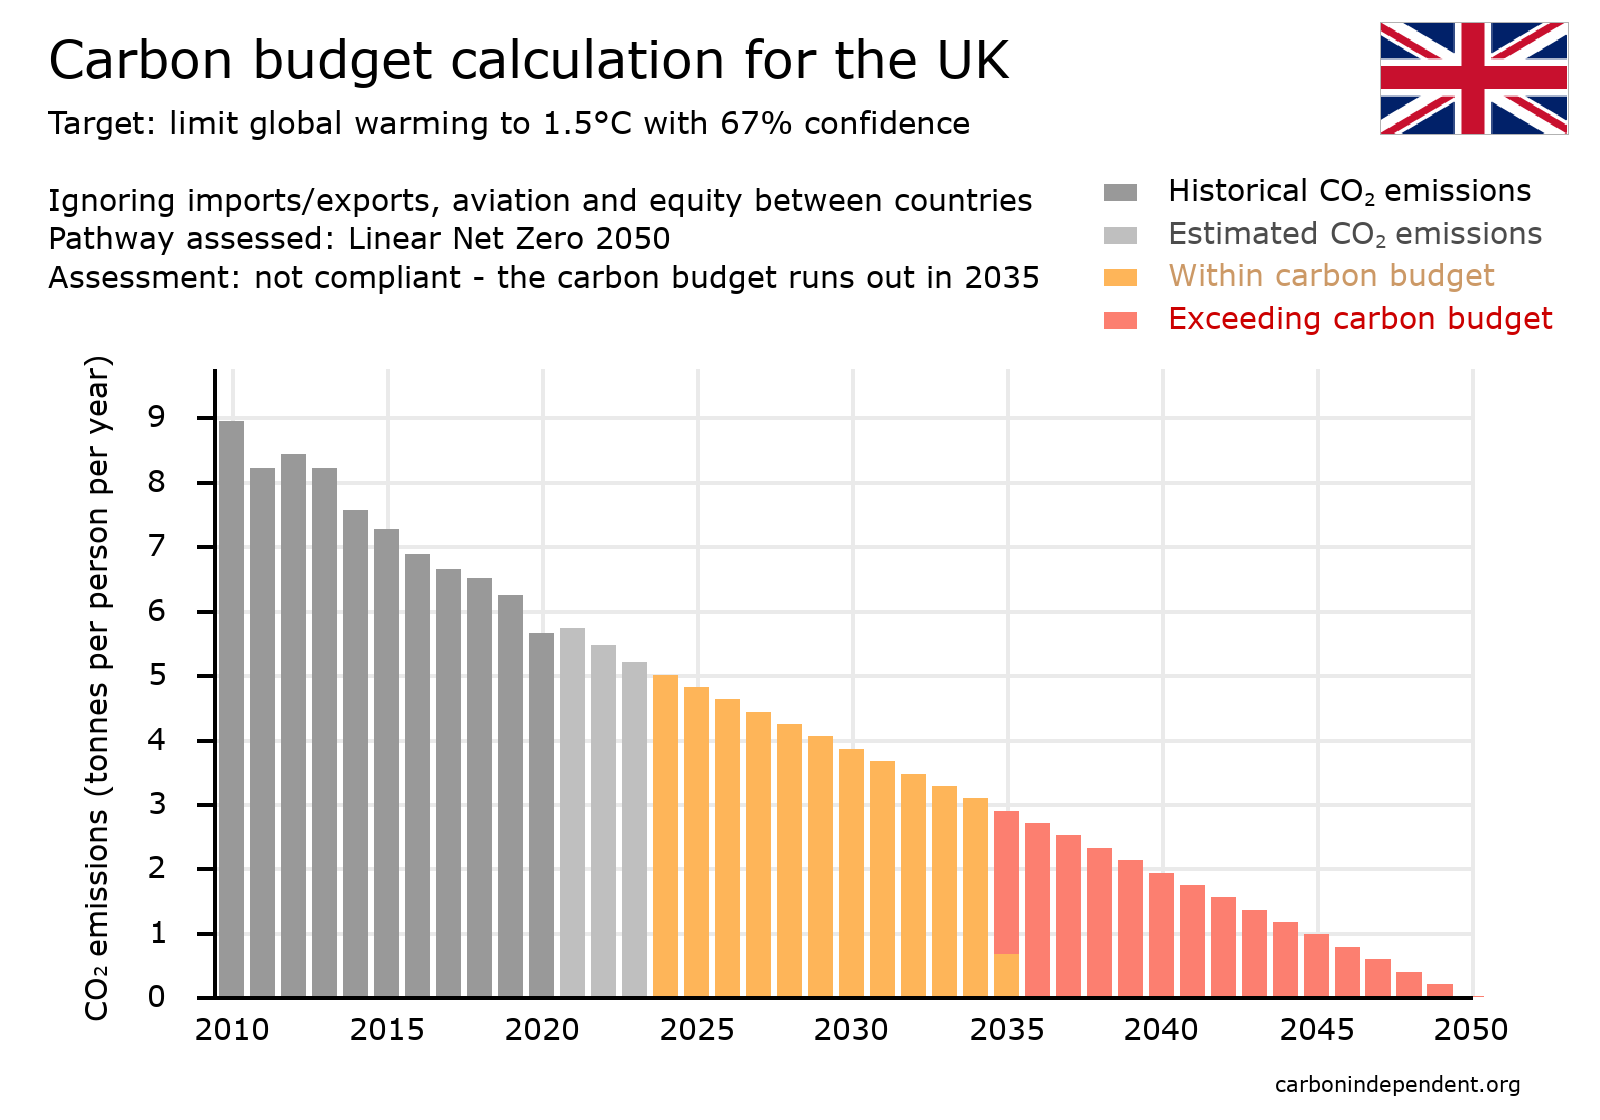 If, in addition to ignoring emissions generated in the production of imports and ignoring emissions from aviation, the Paris Agreement commitment to equity between nations is also ignored, then the UK will take a larger share of the global carbon budget than its per-capita share in line with its current excess above the global average. The carbon budget will be larger and will last longer, i.e. until 2035, as shown in the chart.
 6: Net Zero 2050 (linear decline): effect of also accepting greater risk
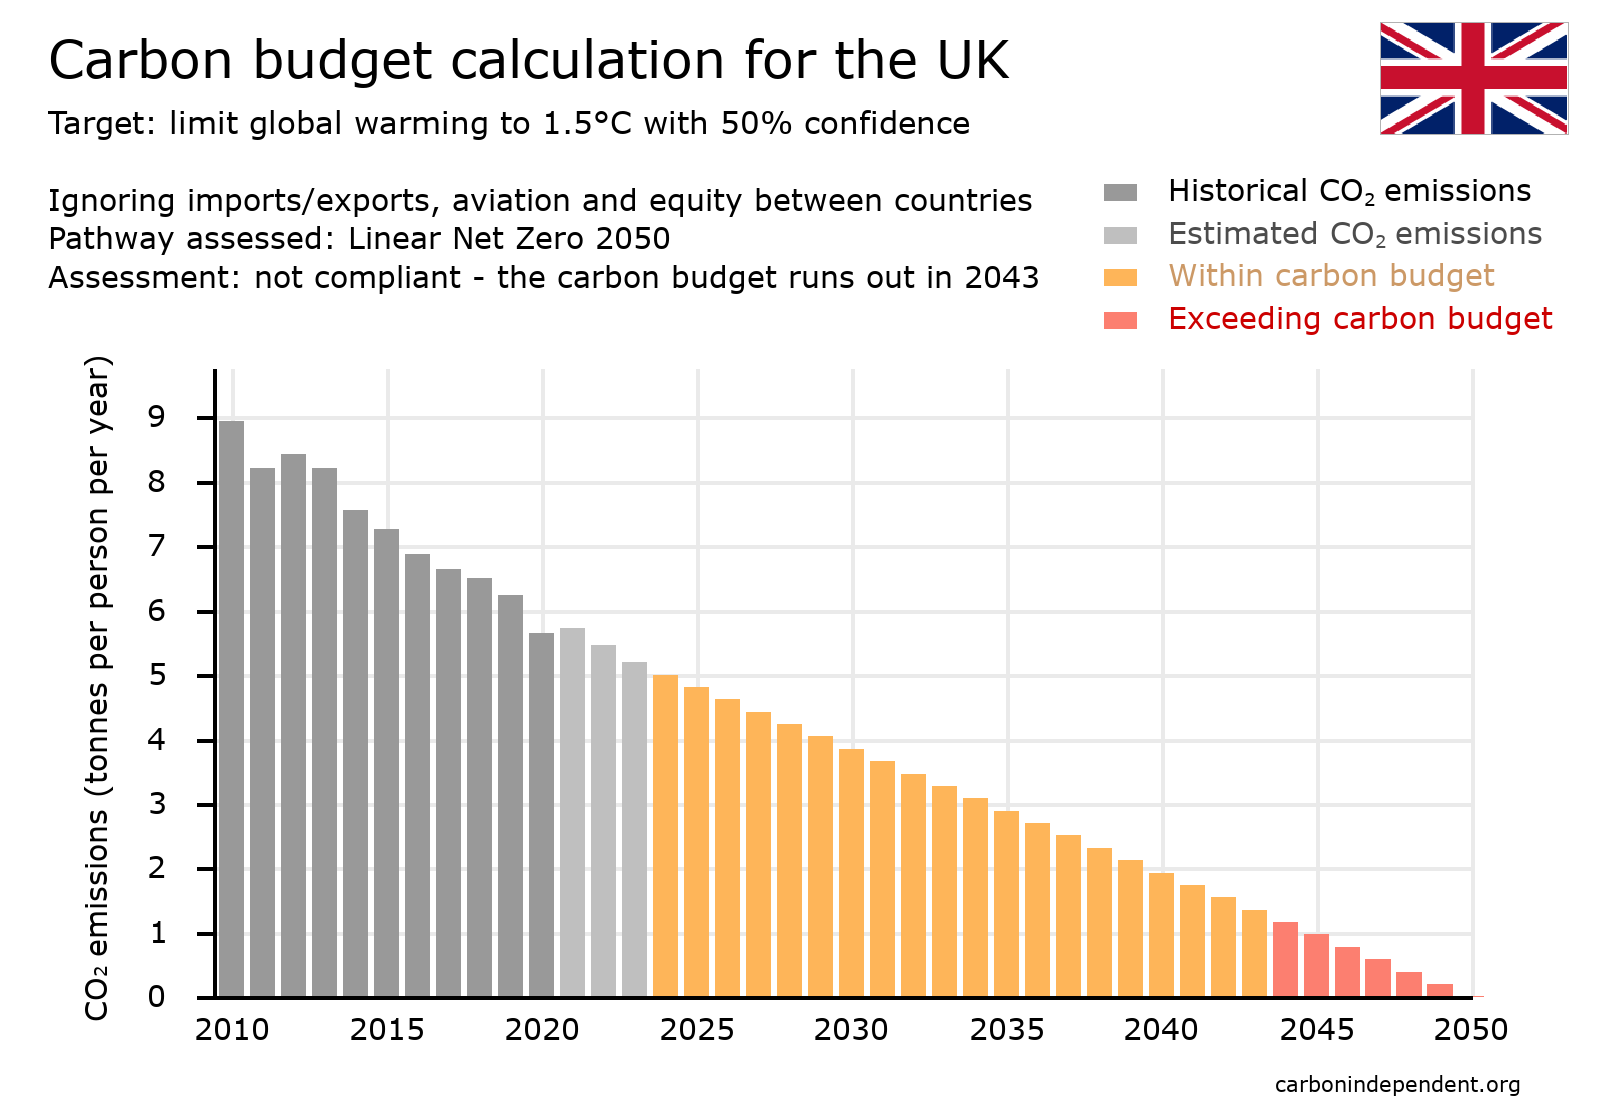 The analyses so far have required a good degree of confidence (67%) of staying within the 1.5°C limit. If, in addition to ignoring emissions generated in the production of imports, ignoring emissions from aviation, and ignoring the commitment to equity between nations, the degree of confidence of meeting the target is reduced from 67% to 50%, then the global carbon budget is higher, the UK's share is higher, and the UK carbon budget will last longer, i.e. until 2043, as shown in the chart.
 These accounting choices are more or less what the UK Government and its Climate Change Committee are taking, and how they justify the net zero 2050 timescale[11]. But not many people think that these choices accord with true and fair accounting[12].
7: Net Zero 2040 (linear decline): not compliant with the carbon budget
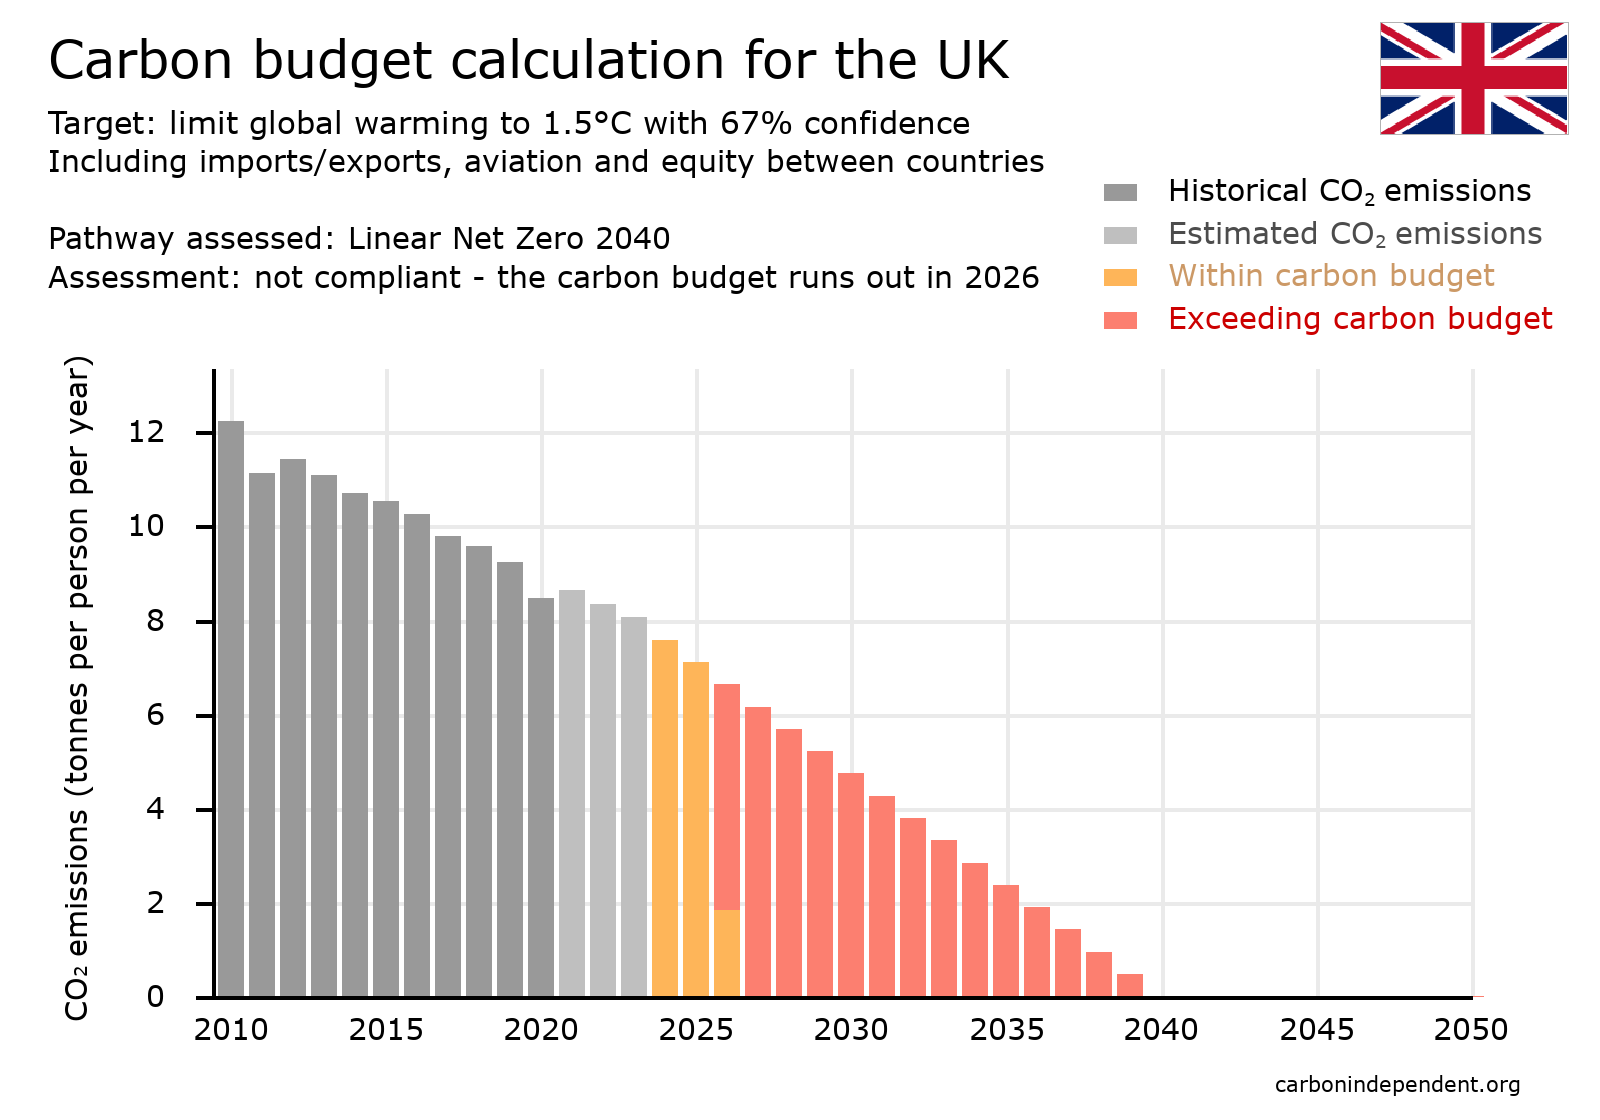 A pathway that reduces emissions faster than net zero 2050 is one that cuts emissions to zero in 2040 as a linear decline.
 Calculations show that this is also inadequate - the budget still runs out in 2026, as shown in the chart. The pathway would in fact emit twice as much CO2 as the carbon budget of 50 tonnes per person.
8: Compliant Net Zero (linear decline): Net Zero 2029
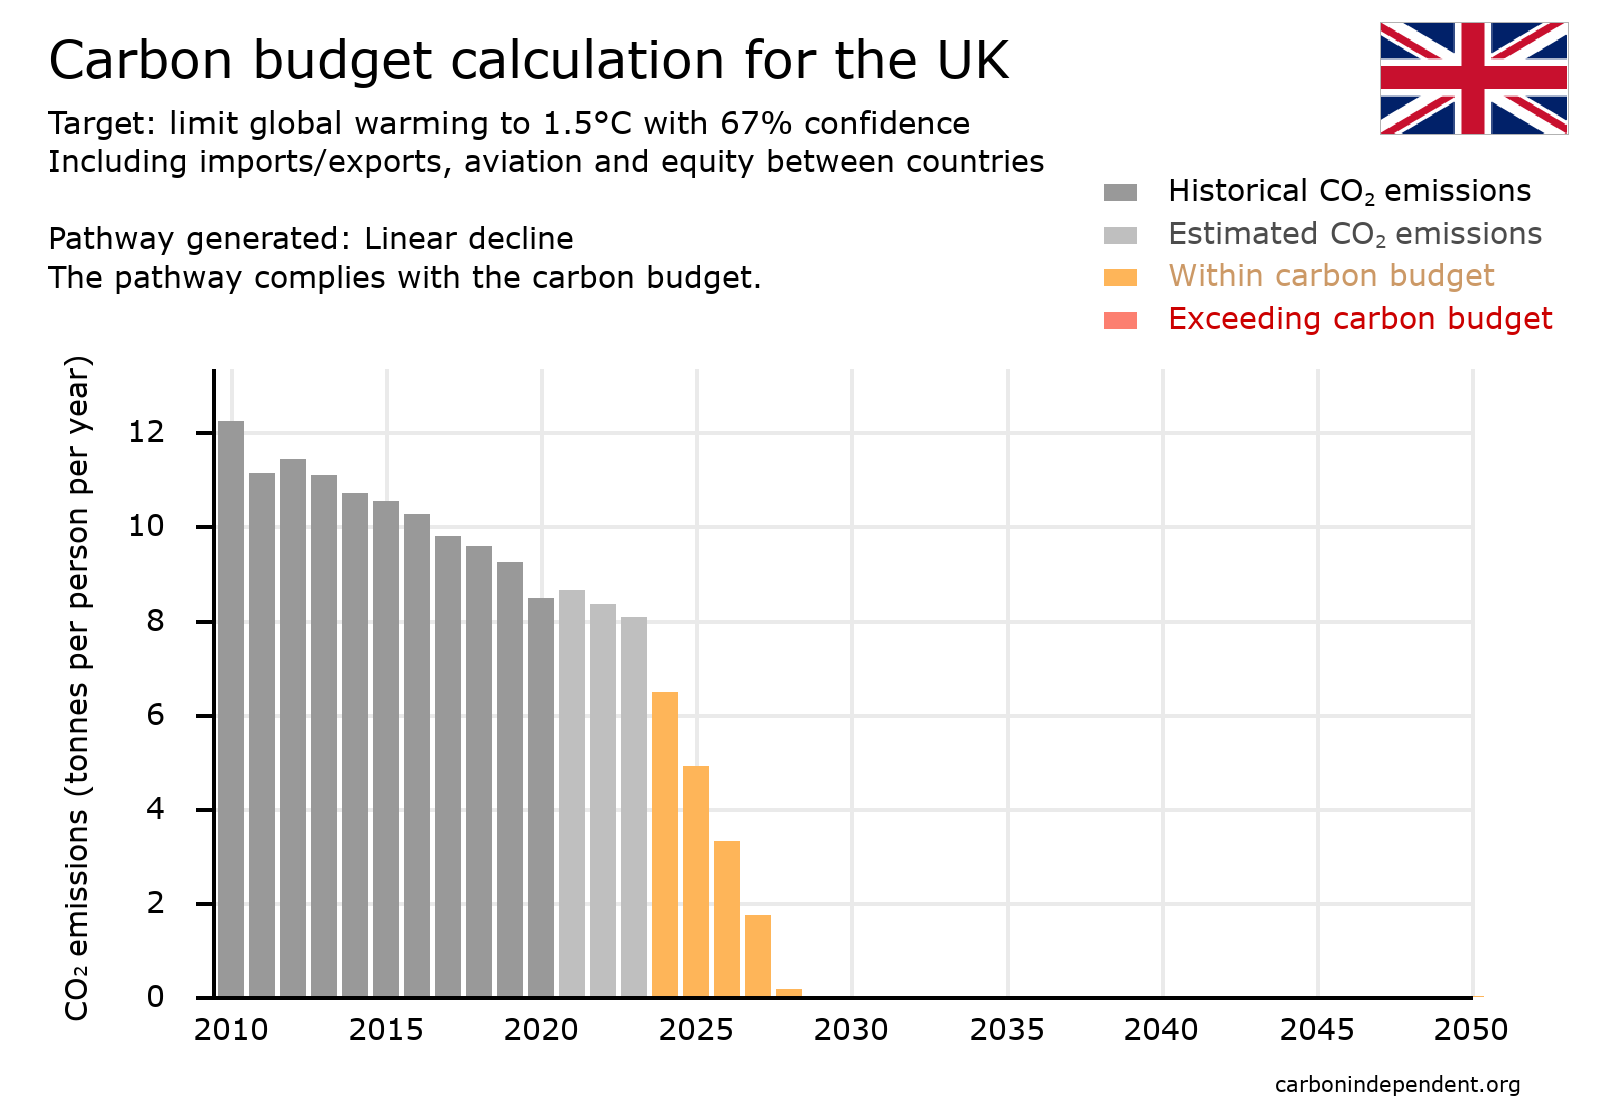 As neither a net zero 2050 pathway or a net zero 2040 pathway (with linear declines) are compatible with the UK's fair carbon budget for 1.5°, the question arises as to how quickly cuts have to be made in order to comply with the budget.
Calculations show that for the UK, emissions need to be cut to zero in 2029 if a linear decline. This is very different to what most people believe, but it is in line with the scientific consensus - see document 33.
9: Compliant exponential decline pathway
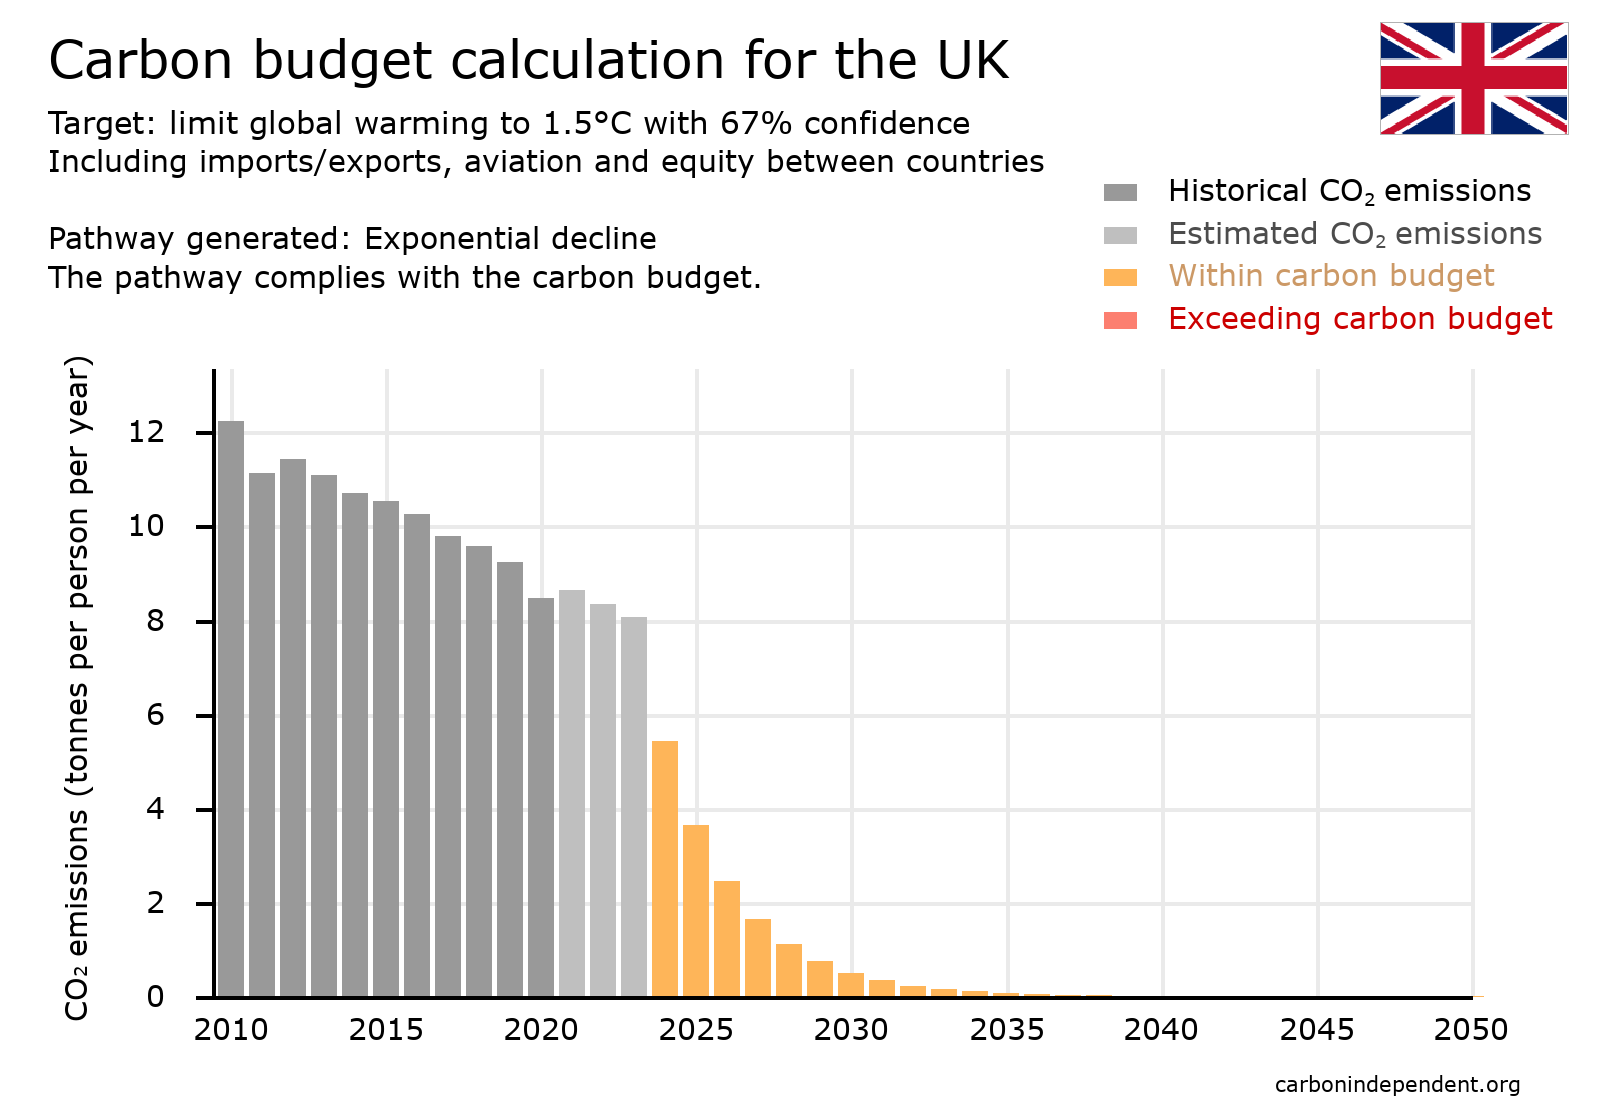 It seems unrealistic to expect emissions to suddenly stop - there are many applications of fossil fuels where a sustainable substitution is difficult. So it is worth considering pathways where emissions tail off towards zero rather than suddenly stopping.
 One option is the exponential decline shown ('exponential decline' being used here in the scientific sense of 'constant halving time'). Emission cuts of over 90% of current values by 2030 are needed to be compliant.
10: Compliant smoothed exponential decline pathway
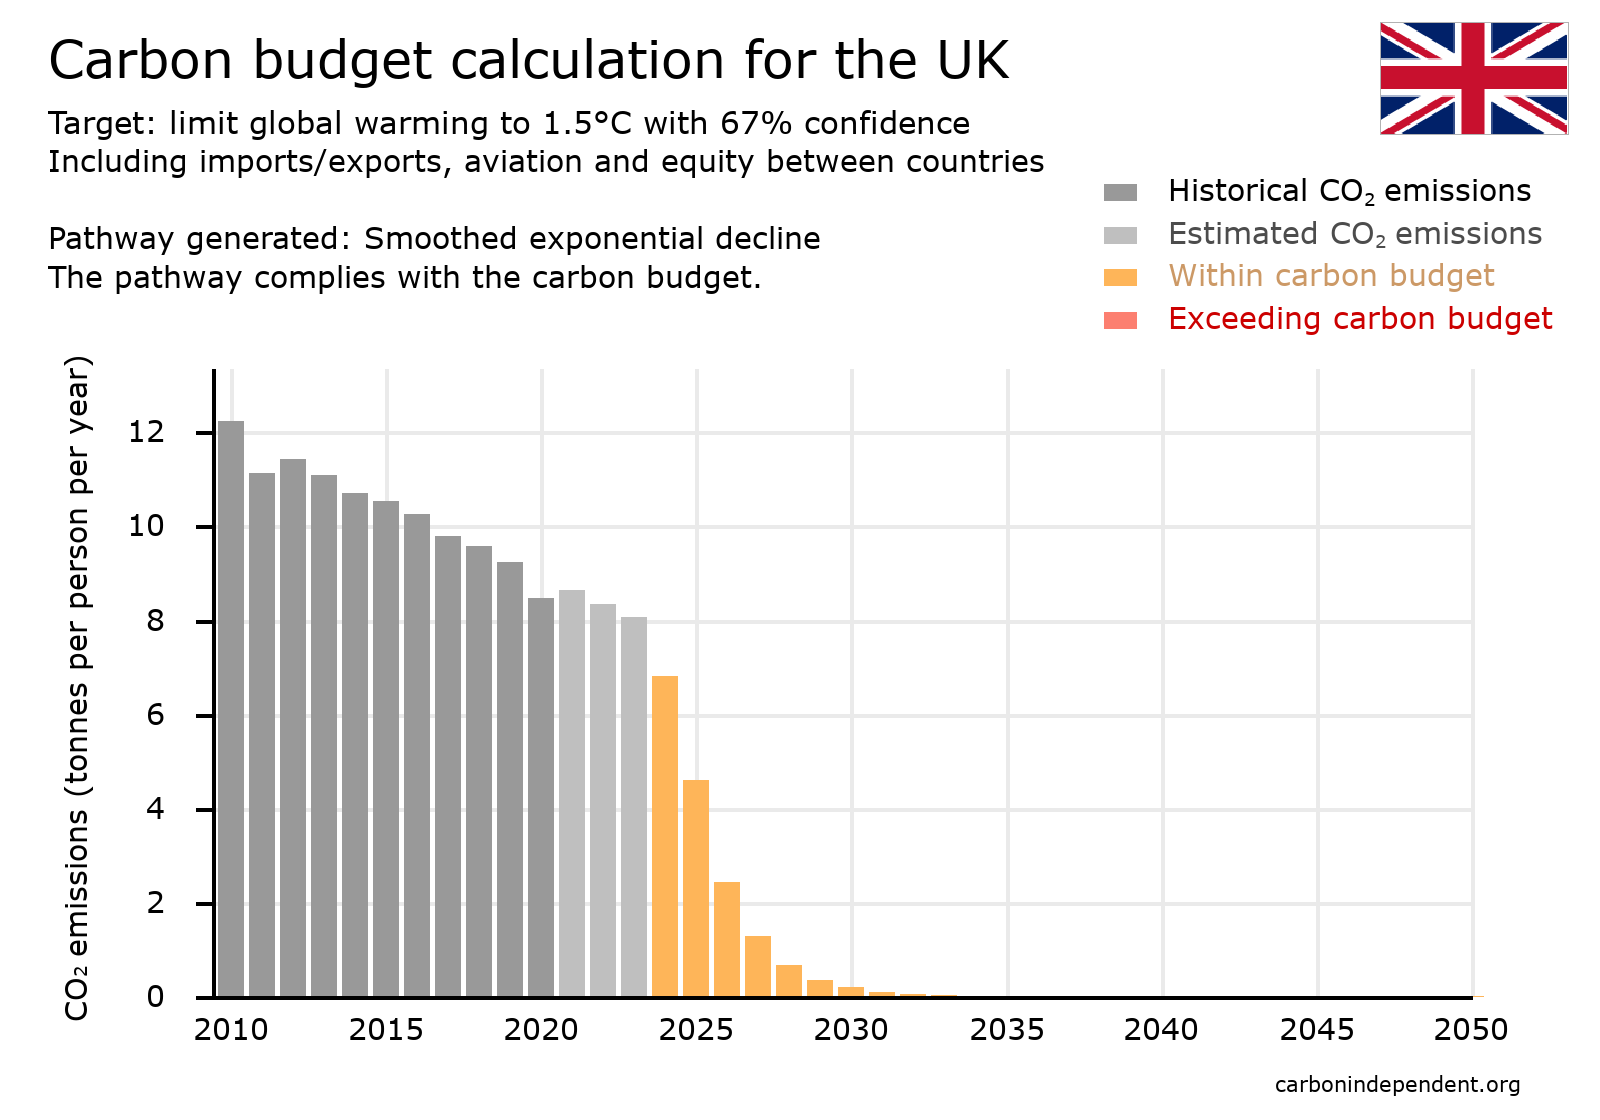 Also, it seems unrealistic for emissions to suddenly start falling rapidly, and a more gradual start to cuts would be preferable. The chart shows a more 'smoothed' or 'rounded' option, that is still consistent with the carbon budget.
Options for limiting global warming to temperatures higher than 1.5°C
Option 11: Compliant smoothed exponential decline - 1.6°C
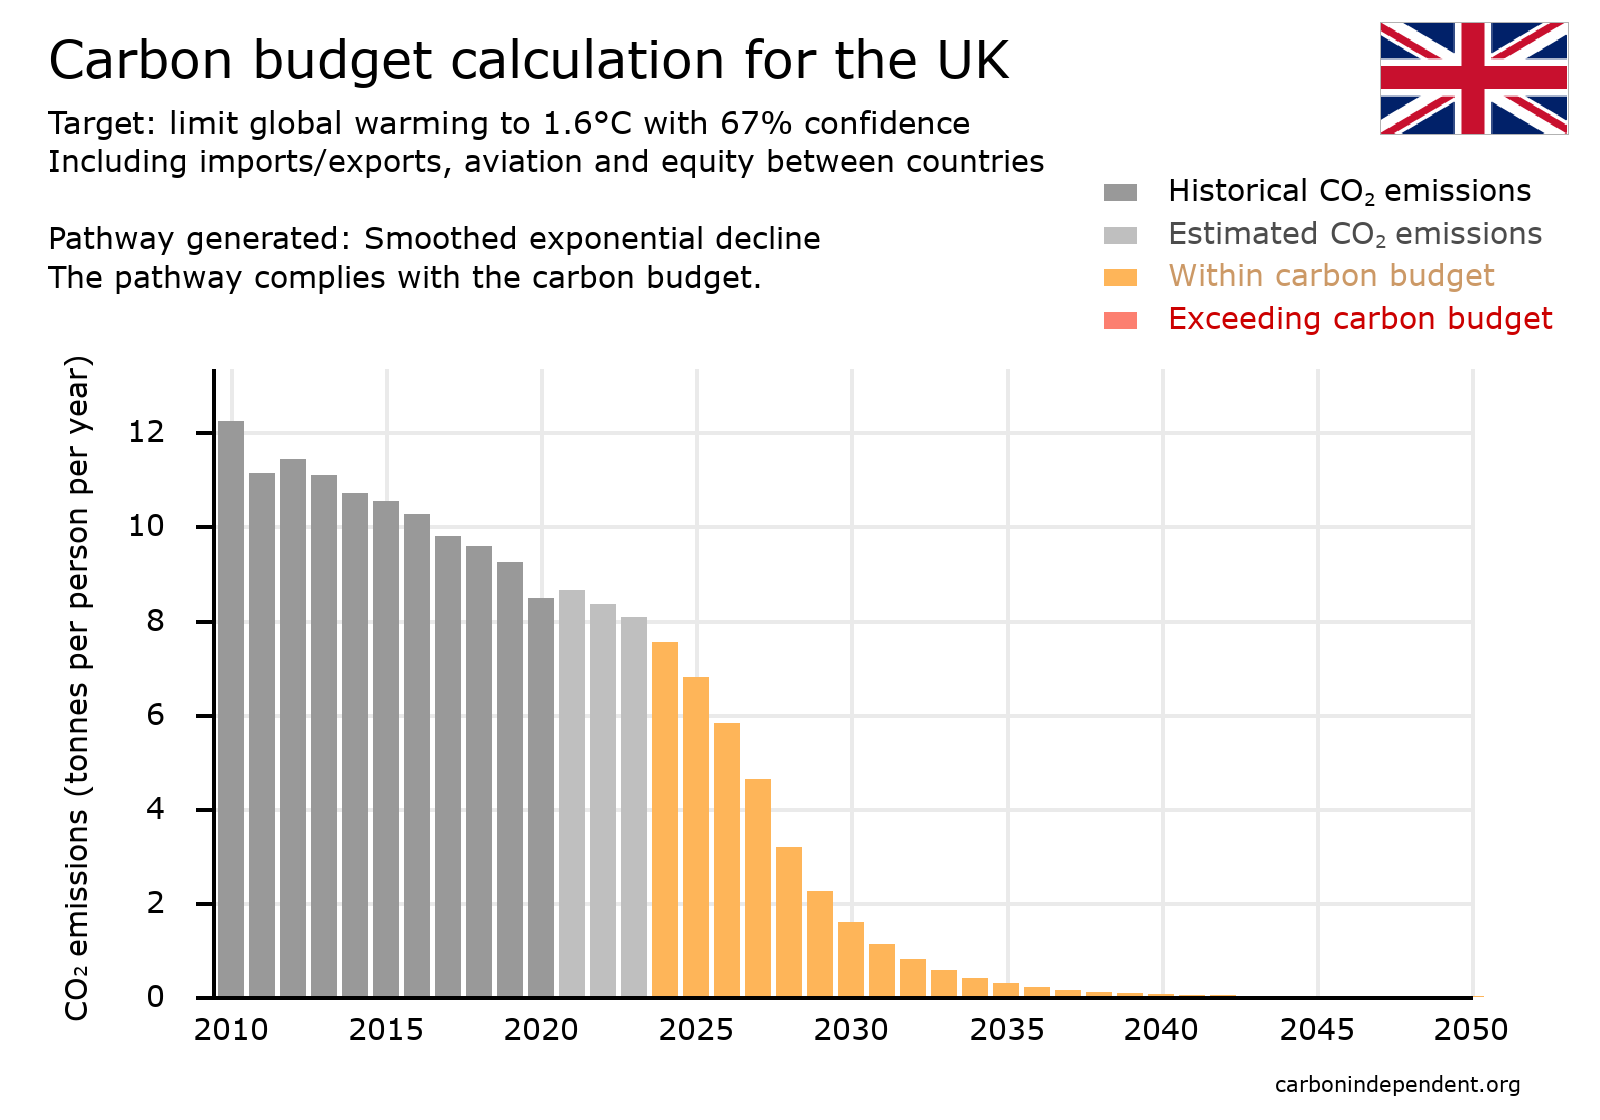 If a higher limit is accepted (e.g. the 1.6°C shown in the chart), then the global carbon budget is greater, and so is the per-capita share for the UK. This means cuts can be slower. But the consequences in terms of climate related deaths, human displacement and biodiversity loss are greater. Many people consider these additional consequences to be unacceptable.
Option 12: Compliant smoothed exponential decline - 1.7°C
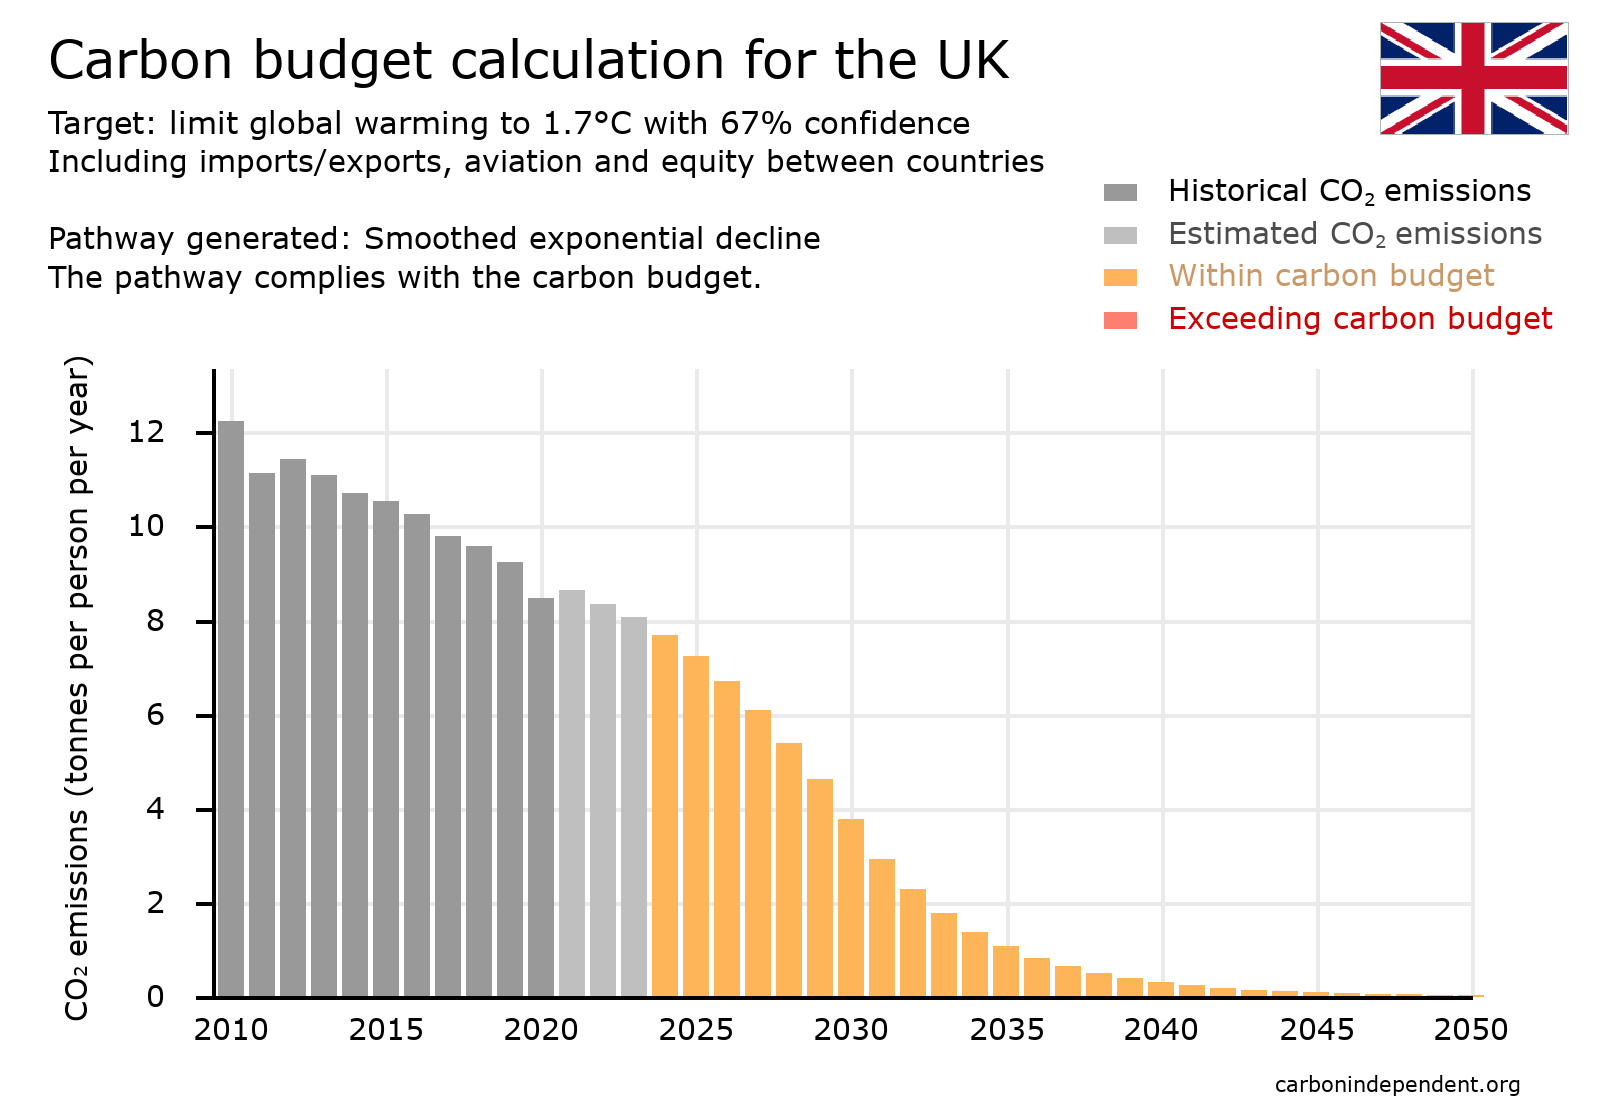 With a still higher limit, e.g. the 1.7°C shown, the global carbon budget is still greater, and so is the per-capita share for the UK. This means cuts can be even slower. But the consequences again are even greater climate related deaths, human displacement and biodiversity loss.
 Showing renewable energy
13: Showing renewable energy with linear extrapolation
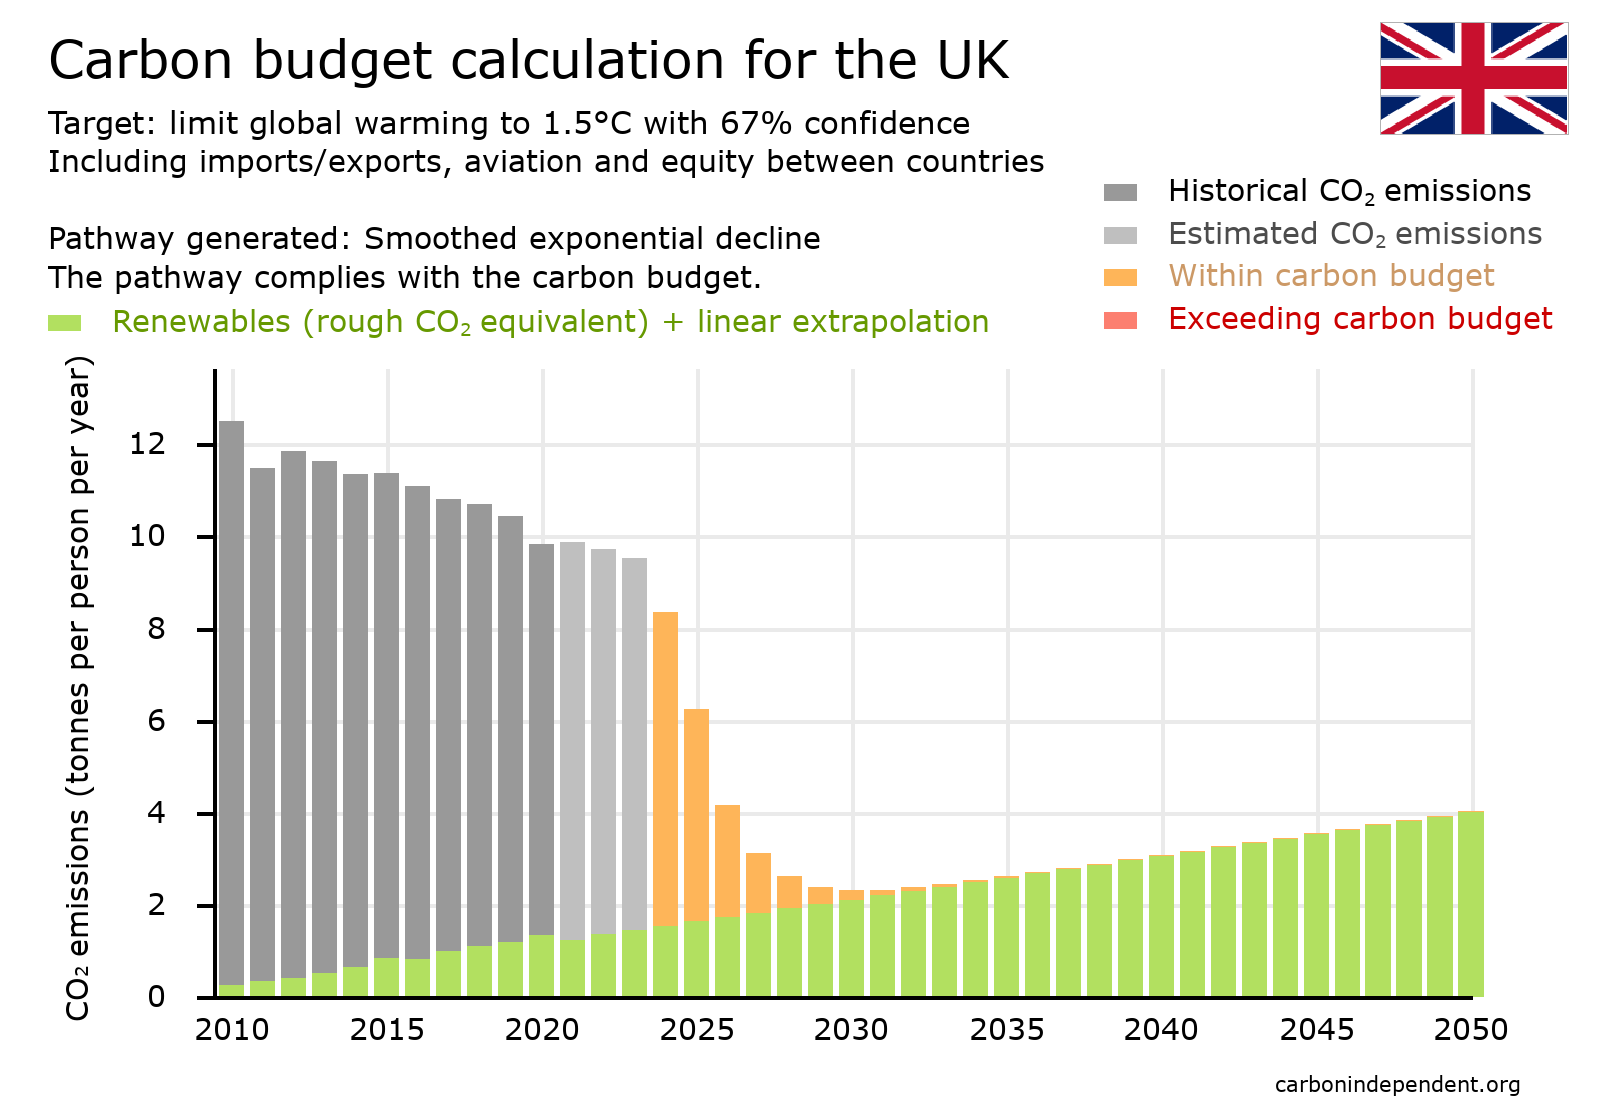 In the UK in 2022, about 19% of primary energy consumption was from renewable sources[13].
 This can be shown on a carbon budget chart via the amount of CO2 that would have been emitted if the energy had been produced from fossil fuels. The chart then indicates the pathway for total energy use.
One possible scenario is that energy use from renewable sources continues to increase by the same annual amount as it has done in recent years. This is termed a linear increase, and is shown on the chart.
14: Showing renewable energy with exponential extrapolation
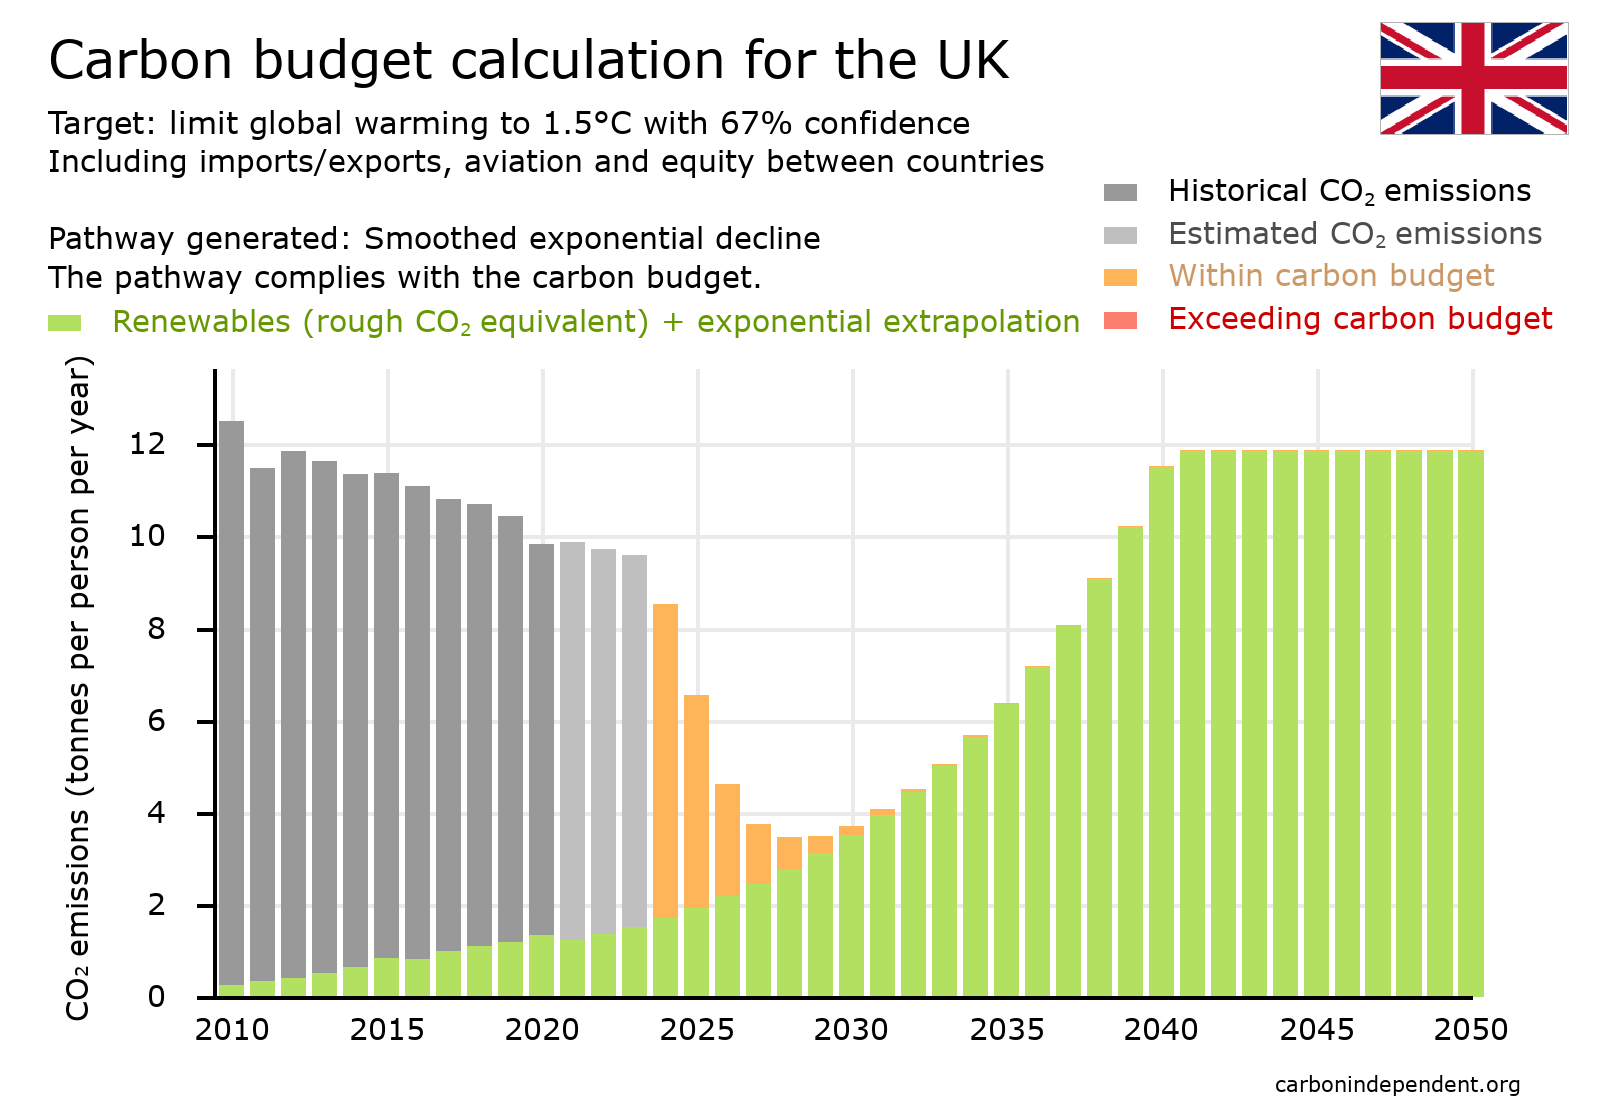 A second possible scenario is that energy use from renewable sources continues to increase at the same annual percentage increase as it has done over recent years. UK renewable energy use has increased by 81% in the last 5 years[13], which equals a 13% compound annual increase.
The final chart shows this UK renewable energy use as a CO2 equivalent, together with extrapolation on the basis that this 13% annual growth continues. Clearly, rapid phasing out of fossil fuels means a radical reduction in total energy use, but this need only be temporary.
Comparison with carbon budget calculations in academic reports
The calculations and conclusions reported here are in line with the scientific consensus on the UK carbon budget e.g. as in publications from UK university departments:- the report Zero Carbon Sooner from the Centre for the Understanding of Sustainable Prosperity (CUSP) at Surrey University[8]
- the Tyndall Centre (Manchester University) carbon budget reports for UK local authorities[9]
- the report in the journal Lancet Planet Health: Is green growth happening? An empirical analysis of achieved versus Paris-compliant CO2-GDP decoupling in high-income countries[10].
When does the UK's fair carbon budget for 1.5°C run out?
- the calculations here give a date of 2026
- the CUSP report gives a date of 2025, on a basis of consumption emissions (i.e. including imports and exports), and including a reduction of 16% in the carbon budget to allow for the UK's historical emissions being above the world average
- the Tyndall reports typically give a date of 2027 using a basis of territorial emissions (territorial emissions were chosen because only territorial data is available at the level of each local authority) - using consumption emission data (if available) would mean the budget runs out sooner.
What emission cuts are needed by 2030 for 1.5°C?
- the calculations here give a figure of over 90% relative to the latest emission figures
- the CUSP report (Figure 2, pathway (d) ) gives around 95%
- the Tyndall reports (published in 2019) typically give around 80%, but with the lack of emission cuts so far, more of the budgets has been used up than recommended, and less is remaining.
- the Lancet Planet Health report (Figure 2) indicates that emission cuts of around 75% by 2030 are needed,but the authors point out that these calculations do not include emissions from aviation and shipping, and that once these are included, larger cuts are needed.
These and other similar calculations have been in the public domain for years, but little attention has been paid to them, suggesting widespread climate denial (denial of implications) across society.
Related pages
See alsoComparison with emission cuts advocated by campaigning organisations
- Just Stop Oil has in 2024 adopted a new demand of zero fossil fuel use by 2030[3], which is in line with the science for a fair 1.5°C UK carbon budget
- Friends of the Earth in 2024 has an inconsistent approach of advocating 50% emission cuts by 2030, and yet a policy document on its website points out that a fair approach would require over 90% cuts by 2030[14].
Conclusion
It has to be concluded that in order to comply with the UK's commitments under the Paris Agreement to keep global warming below 1.5°C, urgent radical emission reductions are needed.The alternatives are
- to ignore some of the CO2 emissions that that citizens are responsible for
- to ignore the commitments in the Paris Agreement to equity between countries and take more than the UK's share of the residual global carbon budget
- to accept a higher limit to global warming than 1.5°C.
None of these alternatives are in accord with basing policies on facts and fairness.
Sources and notes
| [1] | UK Government (2021) Net Zero Strategy: Build Back Greener https://assets.publishing.service.gov.uk/media/6194dfa4d3bf7f0555071b1b/net-zero-strategy-beis.pdf |
| [2] | UK Health Alliance on Climate Change https://ukhealthalliance.org/sustainable-healthcare/ |
| [3] | Just Stop Oil https://juststopoil.org/2024/07/10/paint-the-town-orange-just-stop-oil-wins-first-demand/ |
| [4] | https://unfccc.int/files/meetings/paris_nov_2015/application/pdf/paris_agreement_english_.pdf |
| [5] | Global CO2 budgets: Figures are taken from Table 5.8 (p753) of the AR6 WG1 report produced by the IPCC in 2021 - at https://report.ipcc.ch/ar6/wg1/IPCC_AR6_WGI_FullReport.pdf. |
| [6] | UK CO2 emissions: For years up to 2020, figures are taken from https://ourworldindata.org/grapher/consumption-co2-per-capita and https://ourworldindata.org/grapher/co-emissions-per-capita (downloaded 9 and 26 Oct 2023). Figures for 2021 to 2023 are estimated by extrapolating the trend from 2014 to 2019. |
| [7] | Aviation: Figures are taken from https://ourworldindata.org/carbon-footprint-flying. |
| [8] | Zero Carbon Sooner (2021) https://cusp.ac.uk/wp-content/uploads/WP-29-Zero-Carbon-Sooner-update.pdf |
| [9] | (2019) https://carbonbudget.manchester.ac.uk/reports/ |
| [10] | Is green growth happening? An empirical analysis of achieved versus Paris-compliant CO2-GDP decoupling in high-income countries (2023) Lancet Planet Health https://www.thelancet.com/journals/lanplh/article/PIIS2542-5196(23)00174-2/fulltext |
| [15] | Equity between nations: There is a provision in the Paris Agreement for equity between nations, but this is rarely mentioned in high emission countries - see https://www.carbonindependent.org/122.html. |
| [11] | See https://www.carbonindependent.org/86.html |
| [12] | True and Fair Concept (2023) https://www.frc.org.uk/library/standards-codes-policy/accounting-and-reporting/true-and-fair-concept/ |
| [13] | https://ourworldindata.org/renewable-energy |
| [14] | https://policy.friendsoftheearth.uk/insight/faster-deeper-and-fairer-carbon-pollution-cuts-needed |
| [16] | Military emissions: An adjustment is made on the basis that military emissions are about 5% of the global total (see https://www.sgr.org.uk/sites/default/files/2022-11/SGR%2BCEOBS-Estimating_Global_MIlitary_GHG_Emissions_Nov22_rev.pdf). UK military expenditure is taken from https://ourworldindata.org/grapher/military-expenditure-total?tab=table. This source gives a total global military spend of $1910 billion per annum, which is causing CO2 emissions of 1.85 billion tonnes per year, indicating that on average, 1 tonne of CO2 is emitted per $1000 military spend. An adjustment is added to the UK's declared emission figure according to its military expenditure compared to the global average military spend. |
First published: 3 Mar 2024