
 ✖
✖
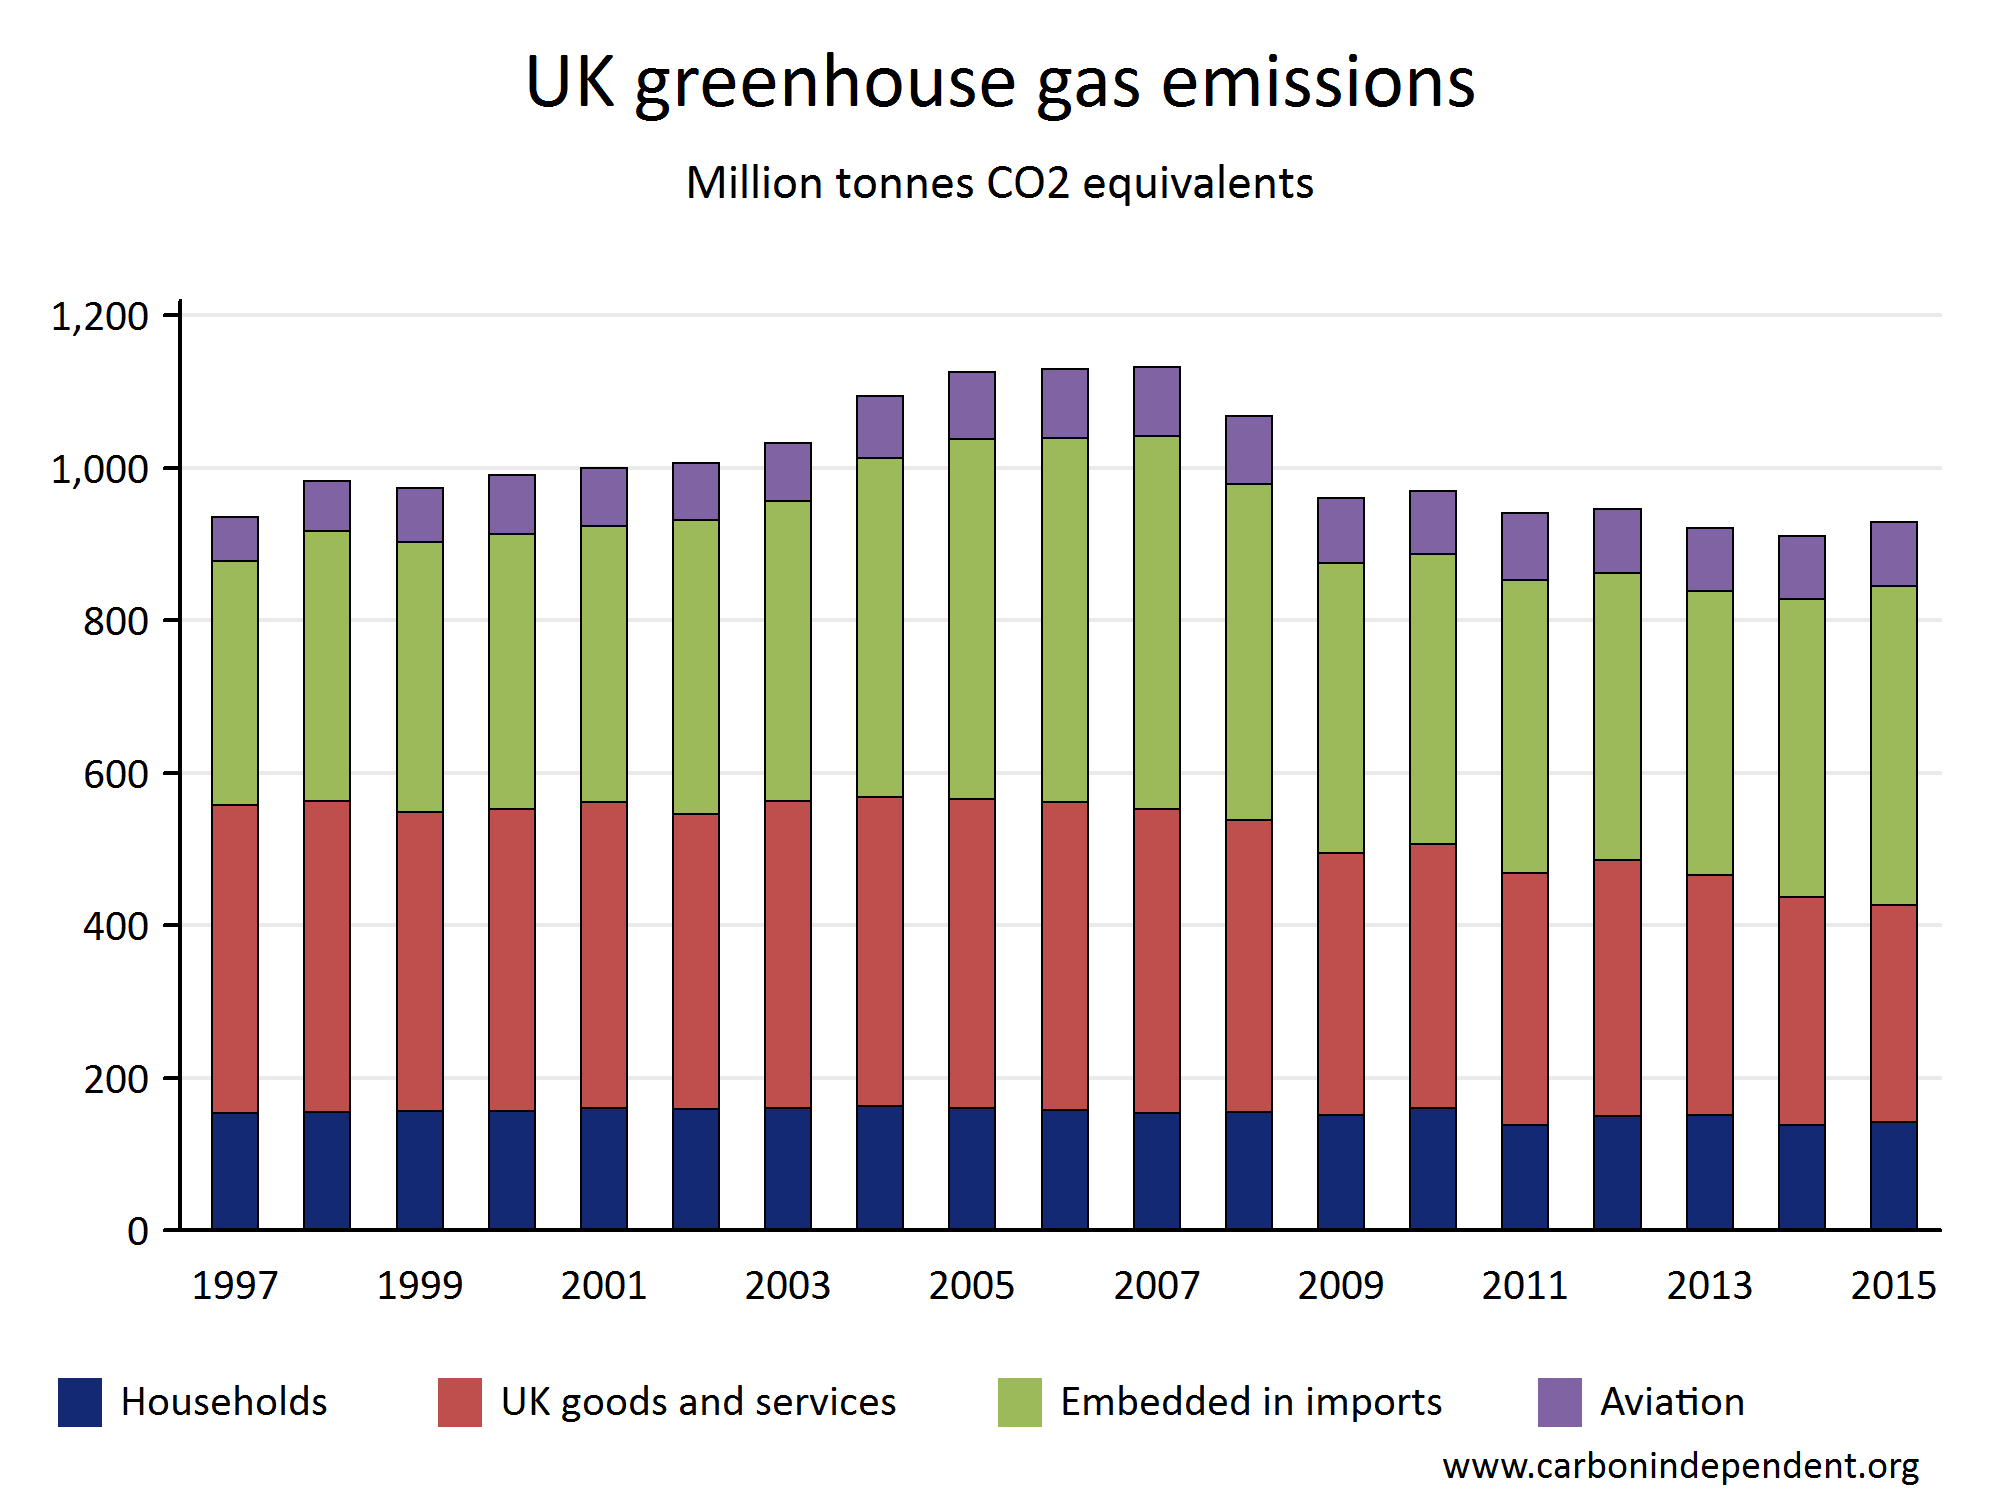
The UK has not cut its greenhouse gas emissions
Taking into account imports and aviation, the UK's total greenhouse gas (GHG) emissions are little different from 1997.
This image is not copyrighted - it can be distributed freely. No permission is required.
Notes
Households: GHG from UK homes and UK personal travel.UK goods and services: GHG from UK produced goods and services consumed by UK residents.
Embedded in imports: GHG from the production of goods and services imported into the UK.
Aviation: GHG from UK residents flying to and from the UK.
Analysis
The GHG emissions generated within the UK have fallen from 1997 to 2015, but the total embedded in imports has risen by a similar amount. This is due to the transfer of much manufacturing from the UK to other countries, especially China.The UK Government often makes claims that the UK has reduced its carbon emissions by a large percentage, and even claims to be a world leader - but this is not a fair summary of the data and appears to be deliberately deceitful.
There has also been a switch in the fuel used for UK electricity production, from coal to gas, and the UK Government often claims credit for this, but major factors in the switch have been an EU directive on air quality (burning coal produces more particulate pollution), and the cheaper price of gas.
In summary, the claims of the UK government are misleading and appear to be deliberately deceitful. See also BEIS is not telling the truth on carbon emissions at https://www.carbonindependent.org/85.html.
Greta Thunberg's assessment
This is an excerpt from her speech to UK MPs on 23 Apr 2019.The UK is, however, very special. Not only for its mind-blowing historical carbon debt, but also for its current, very creative, carbon accounting.
Since 1990 the UK has achieved a 37% reduction of its territorial CO2 emissions, according to the Global Carbon Project. And that does sound very impressive. But these numbers do not include emissions from aviation, shipping and those associated with imports and exports. If these numbers are included the reduction is around 10% since 1990 � or an an average of 0.4% a year, according to Tyndall Manchester.
And the main reason for this reduction is not a consequence of climate policies, but rather a 2001 EU directive on air quality that essentially forced the UK to close down its very old and extremely dirty coal power plants and replace them with less dirty gas power stations.
https://www.theguardian.com/environment/2019/apr/23/greta-thunberg-full-speech-to-mps-you-did-not-act-in-time
Information sources
Data for the first three catagories is from DEFRA - see https://assets.publishing.service.gov.uk/government/uploads/system/uploads/attachment_data/file/704607/Consumption_emissions_May18.pdf and https://www.gov.uk/government/uploads/system/uploads/attachment_data/file/704425/UK-Carbon_Footprint_1997_2015.ods.The data for aviation is from the BEIS file https://www.ons.gov.uk/file?uri=/economy/environmentalaccounts/datasets/ukenvironmentalaccountsfuelusebytypeandindustry/current/fuelusebytypeandindustry.xls. Figures for CO2 production are adjusted by a radiative forcing factor of 1.9, together with a factor of 1.25 to allow for the relative proportion (resident/foreign) of passengers passing through UK airports - see https://www.carbonindependent.org/22.html.
First published: Dec 2018
Last updated: 8 Dec 2019